Twitter Follower Analytics Strategies for Growth
Learn how to use Twitter follower analytics to track growth, find optimal posting times, understand demographics, and boost engagement for lasting results.
Introduction to Twitter Follower Analytics for Sustainable Growth
In the competitive arena of social media marketing, Twitter follower analytics has become an indispensable tool for brands, creators, and professionals looking to expand their influence. Merely tweeting on a schedule isn’t enough—success depends on understanding your audience’s behaviors, preferences, and engagement patterns.
Follower analytics helps you:
- Track how your follower count changes over time
- Discover the demographics and interests of your audience
- Identify the types of content that generate the most interaction
- Pinpoint optimal posting times for maximum reach
When applied strategically, these data-driven insights enable smarter decisions, improved engagement rates, and consistent growth in both followers and ROI.

---
Overview of Twitter’s Native Analytics Dashboard
Twitter’s native analytics dashboard, available at `analytics.twitter.com`, offers a streamlined view of your profile’s performance, divided into easy-to-interpret sections.
Key Metrics Explained
- Follower Count – Tracks total followers and net gains or losses over time.
- Tweet Impressions – The number of times users have viewed your tweets.
- Profile Visits – The frequency at which people click through to your profile.
- Mentions – How often your handle is tagged or mentioned by others.
- Engagement Rate – Engagements (likes, replies, retweets, clicks) as a percentage of impressions.
By focusing on these indicators, you can readily evaluate whether your content strategy is driving the desired results.
---
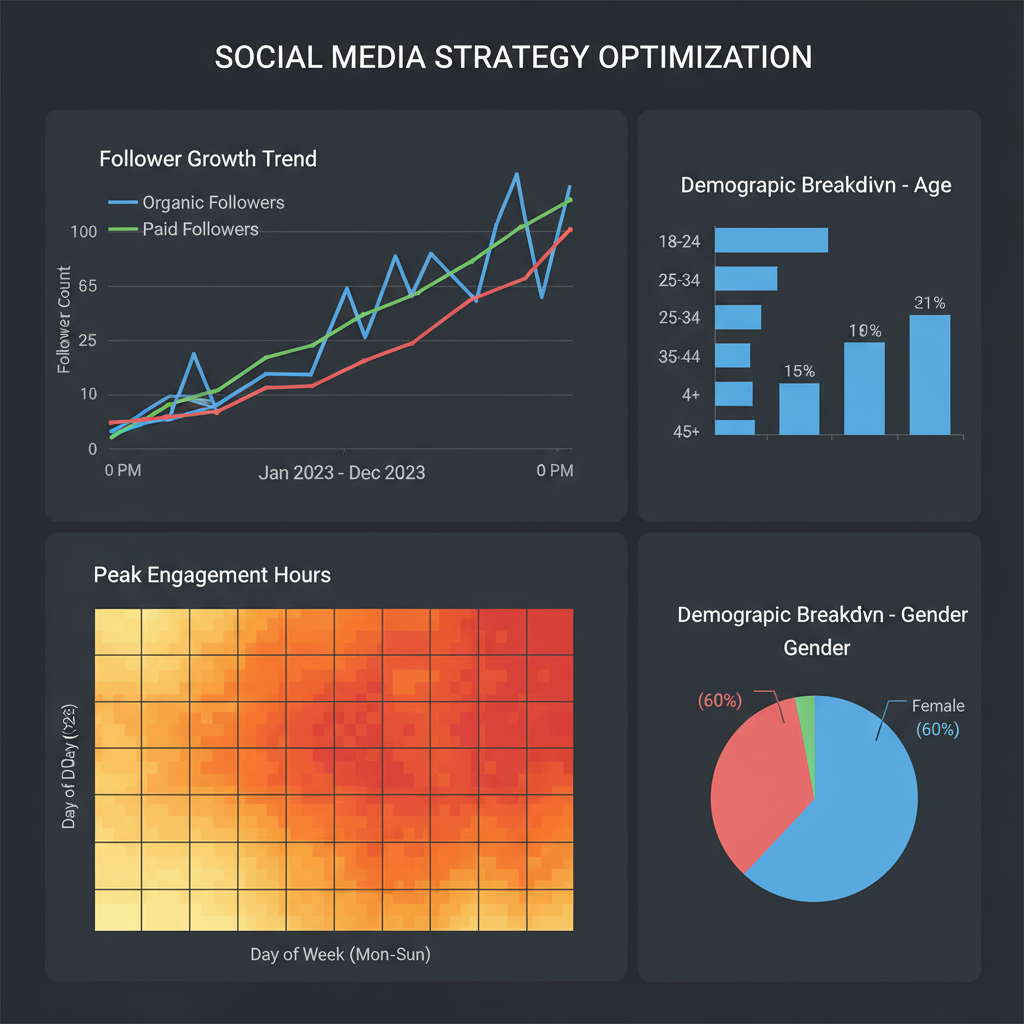
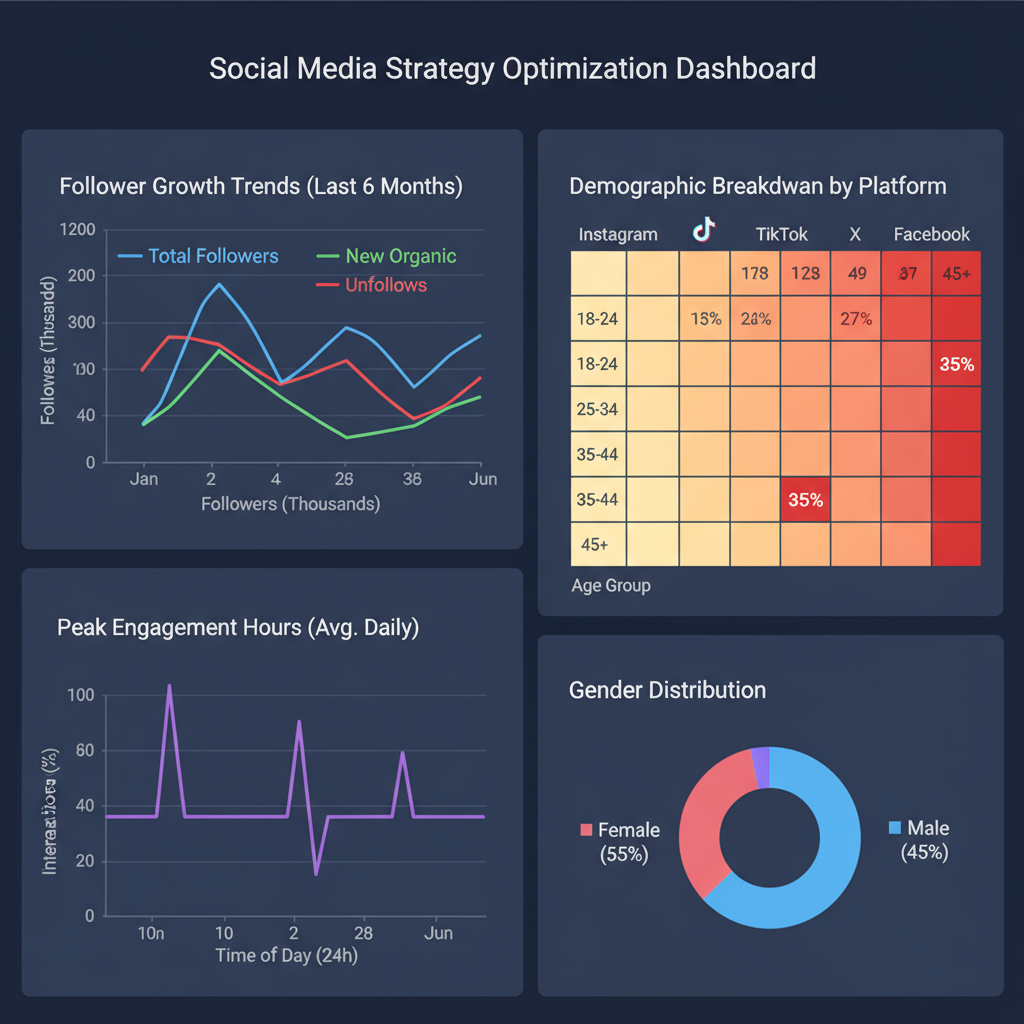
Tracking Follower Growth Trends
Follower growth should be evaluated in terms of pattern and pace, not just total numbers. Trends can highlight the impact of specific campaigns or events on acquisition.
How to track trends effectively:
- Record follower counts weekly or monthly.
- Cross-reference with posting frequency and engagement changes.
- Highlight anomalies such as spikes from viral tweets or dips from controversial topics.
Exporting analytics data into spreadsheets or graphing tools makes it easier to visualize your journey over time.
---
Pinpointing Optimal Posting Times from Engagement Data
Publishing content at the right moment can significantly boost reach. While Twitter doesn’t show time-specific engagement stats directly, you can identify trends by analyzing performance across varied posting schedules.
Steps to discover peak posting hours:
- Share tweets at different times over several days.
- Compare impressions and engagements for each time slot.
- Find windows with the best engagement-to-impression ratio.
Integrating this insight into social scheduling tools ensures maximum visibility for future posts.
---
Understanding Follower Demographics to Guide Strategy
Audience composition is just as critical as follower count. Twitter analytics reveals useful demographic details, including:
- Geographic location (country and city level)
- Gender distribution
- Interests and preferred topics
Leverage these insights to:
- Adapt tone, language, and content to match your audience
- Time content around local events or holidays
- Partner with influencers who reach similar demographics
---
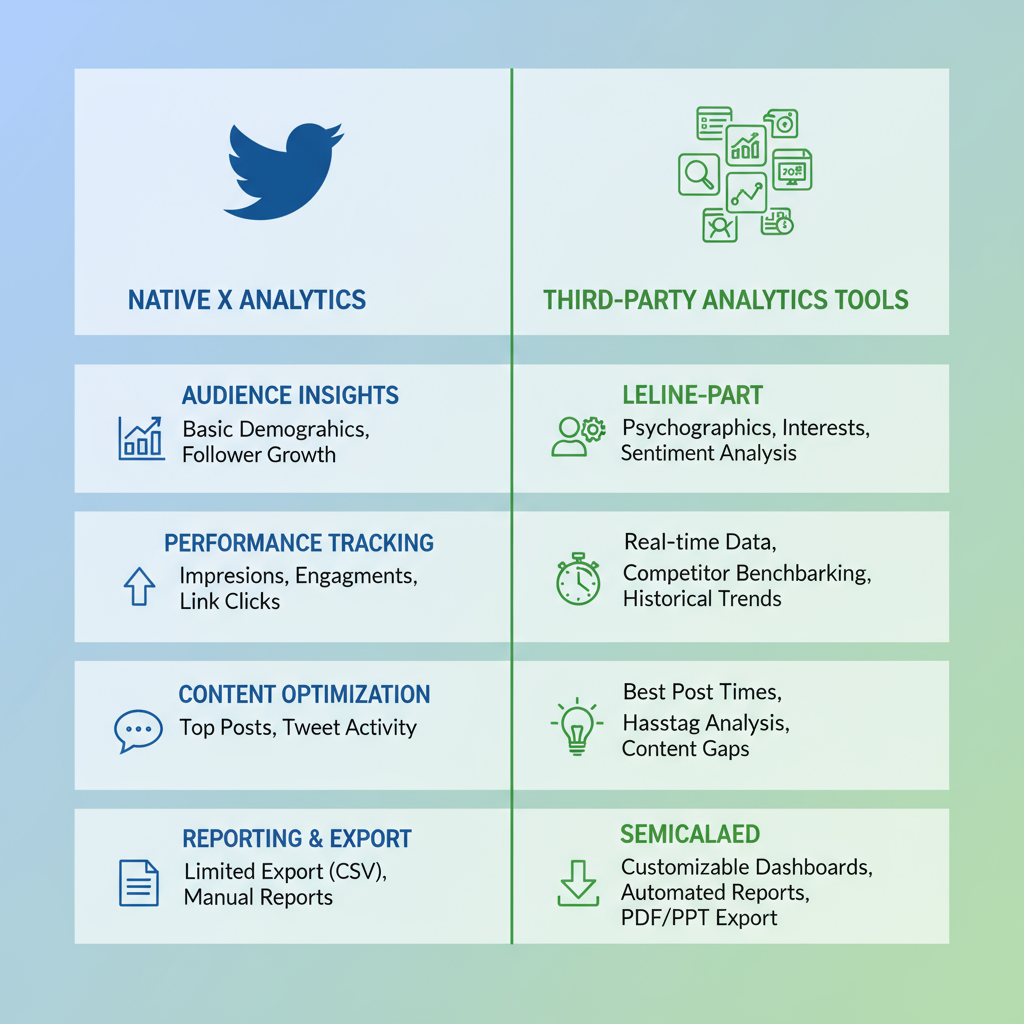
Leveraging Third-Party Tools for Advanced Analytics
Although Twitter’s native analytics is valuable, it may lack historical depth or detailed segmentation. Third-party tools bridge these gaps.
Popular options:
- Followerwonk – Ideal for analyzing bio data and follower optimization.
- Hootsuite Analytics – Provides robust multi-platform tracking.
- Sprout Social – Offers customizable reports and sentiment analysis.
These platforms can:
- Store and visualize long-term metrics
- Segment followers using advanced filters
- Benchmark results against competitors
---
Monitoring Tweet Engagement for Performance Insights
Evaluating engagement metrics clarifies which content resonates most. Key measures include:
| Metric | What It Measures | Why It Matters |
|---|---|---|
| Retweets | Number of shares | Shows shareability and topic appeal |
| Likes | Positive acknowledgement | Reflects emotional resonance or agreement |
| Replies | Direct responses | Indicates depth of engagement and conversation |
| Link Clicks | Clicks on embedded URLs | Proves interest in external resources |
This analysis guides you to replicate high-performing formats and rework underperforming ones.
---
Segmenting Followers by Engagement and Interest
Follower segmentation enables more personalised content strategies.
Key segments to consider:
- High-engagement advocates – Frequently interact and share your content.
- Topic-focused followers – Primarily interested in certain subjects you cover.
- Passive followers – Seldom engage but still contribute to reach.
CRM platforms or analytics tools can automate segmentation, ensuring each group receives tailored messages.
---
Converting Insights into Actionable Experiments
Insights only drive growth when acted upon. Use findings to design A/B tests:
- Compare engaging headlines versus concise statements.
- Assess visual tweets against text-only versions.
- Contrast short updates with detailed threads.
Document performance changes to refine your approach over time.
---
Setting Goals and Reviewing Monthly Progress
Analytics efforts yield the best results when aligned with specific, measurable goals, such as:
- Increase followers by 15% within three months
- Boost engagement rate by 1%
- Achieve 500 link clicks per month
Monthly review process:
- Export and store your analytics data.
- Compare against previous months’ figures.
- Evaluate changes in strategy for effectiveness.
---
Avoiding Common Analytics Misinterpretations
Misreading data can derail your content strategy. Avoid these mistakes:
- Focusing on vanity metrics without considering ROI
- Overlooking audience context, which varies by niche
- Ignoring seasonality and special events that influence results
- Reacting to anomalies without reviewing long-term trends
Maintain perspective to base decisions on reliable patterns rather than isolated incidents.
---
Case Study: Analytics-Driven Engagement Boost
Consider a technology blogger with 5,000 followers:
After three months of analytics-led changes, they:
- Found 9 a.m. posts increased engagement by 35%
- Discovered infographics outperformed plain text tweets
- Adjusted posting schedule and content accordingly
Results:
- Follower count rose to 5,800
- Engagement rate improved from 2.5% to 4.1%
- Link clicks doubled month-over-month
This example demonstrates how precise Twitter follower analytics can lead to measurable, sustained growth.
---
Conclusion: Turning Data into Daily Strategy
To successfully integrate Twitter follower analytics into daily operations:
- Schedule a weekly 15-minute review of top metrics
- Record trends in a spreadsheet or dashboard
- Automate reports using tools such as Hootsuite
- Quickly adapt messaging and schedules based on findings
By consistently applying analytical insights, you’ll cultivate a more engaged, loyal audience—and transform raw numbers into real influence. Keep refining, testing, and measuring for ongoing success.