Media Report Example and Formatting Guide for Writers
Learn how to create a professional media report with clear structure, accurate data, and formatting tips to effectively present campaign results.

Introduction to Crafting a Media Report Example
Creating a professional media report example is critical for showcasing the performance and impact of media activities, from public relations campaigns to social media strategies. A well-prepared report provides stakeholders with clear, data-driven insights and actionable recommendations. This guide walks you through key elements, formatting tips, and presentation strategies to ensure your media report effectively communicates results and informs future decisions.
---
Understanding a Media Report and Its Purpose
A media report is a structured document that presents information, data, and analysis about media coverage, campaigns, or related activities. It can summarize public relations efforts, advertising performance, social media engagement, or press exposure. The purpose is to inform stakeholders — such as clients, management, or team members — about the effectiveness and impact of media-related initiatives.
Media reports help guide decision-making, measure success, and identify improvement areas. They serve as an authoritative record and often play a critical role in strategy formulation.
---
Identifying the Target Audience and Report Goals
Before writing a media report, define who will read it and why. The audience could include:
- Senior management
- Public relations teams
- Marketing executives
- External stakeholders like investors or partners
The goals might be:
- To show ROI from a media campaign
- To highlight achievements
- To reveal trends or changes in audience sentiment
- To suggest strategic improvements
Clearly articulating these at the start will shape the content, tone, and level of detail in the report.
---
Research and Gathering Accurate Data
Accurate data collection is the foundation for any media report example. Sources may include:
- Social media analytics (reach, impressions, engagement rates)
- Press coverage tracking tools
- Website analytics (traffic, referral sources, bounce rates)
- Surveys and feedback forms
- Industry benchmarks for comparison
Always validate your sources and include the date ranges for any campaign or monitoring period.
---
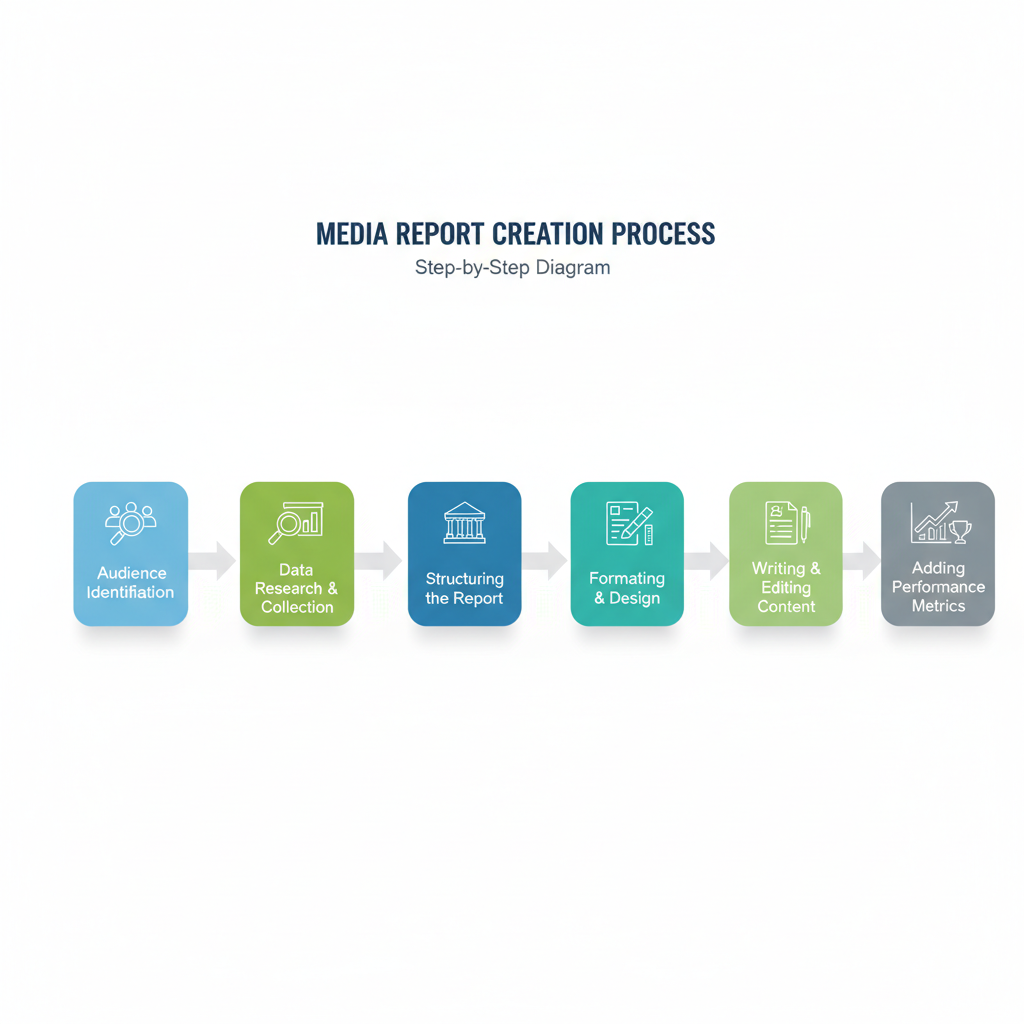
Structuring the Media Report
A robust media report should follow a logical structure. Common sections include:
- Title Page
- Report title
- Date
- Prepared by and for
- Executive Summary
- Concise overview of key findings
- Main metrics and conclusions
- Body
- Detailed analysis across campaigns or channels
- Supporting data and interpretation
- Conclusion
- Summary of insights
- Recommendations or next steps
---
Format Guidelines: Headings, Subheadings, Bullet Points, Tables, Visuals
Clarity and organization improve the report’s readability and professionalism. Use:
- Headings to reflect main sections
- Subheadings to break content into manageable parts
- Bullet points for key findings
- Tables for structured numerical or categorical data
- Visuals like charts and graphs to make data more digestible
Here’s a basic HTML table example for incorporating metrics:
| Metric | Value | Period |
|---|---|---|
| Total Reach | 1.2M | Jan–Mar 2024 |
| Engagement Rate | 5.4% | Jan–Mar 2024 |
| Impressions | 3.5M | Jan–Mar 2024 |
| Positive Sentiment | 72% | Jan–Mar 2024 |
---
Writing Style Tips: Clarity, Conciseness, Active Voice
Strong writing ensures that the report is impactful. Consider:
- Clarity: Use plain, straightforward language.
- Conciseness: Avoid unnecessary jargon and filler words.
- Active Voice: Makes sentences more direct and engaging.
- Tone: Adapt based on your audience; formal for executives, slightly conversational for internal teams.
---
Including Metrics: Reach, Engagement, Impressions, Sentiment Analysis
Metrics are the heart of demonstrating media performance:
- Reach: Number of unique people exposed to content.
- Engagement: Actions taken by users (likes, shares, comments).
- Impressions: Total times content was displayed.
- Sentiment Analysis: Positivity or negativity in public commentary.
Where possible, use benchmarks to compare performance against industry averages.
---
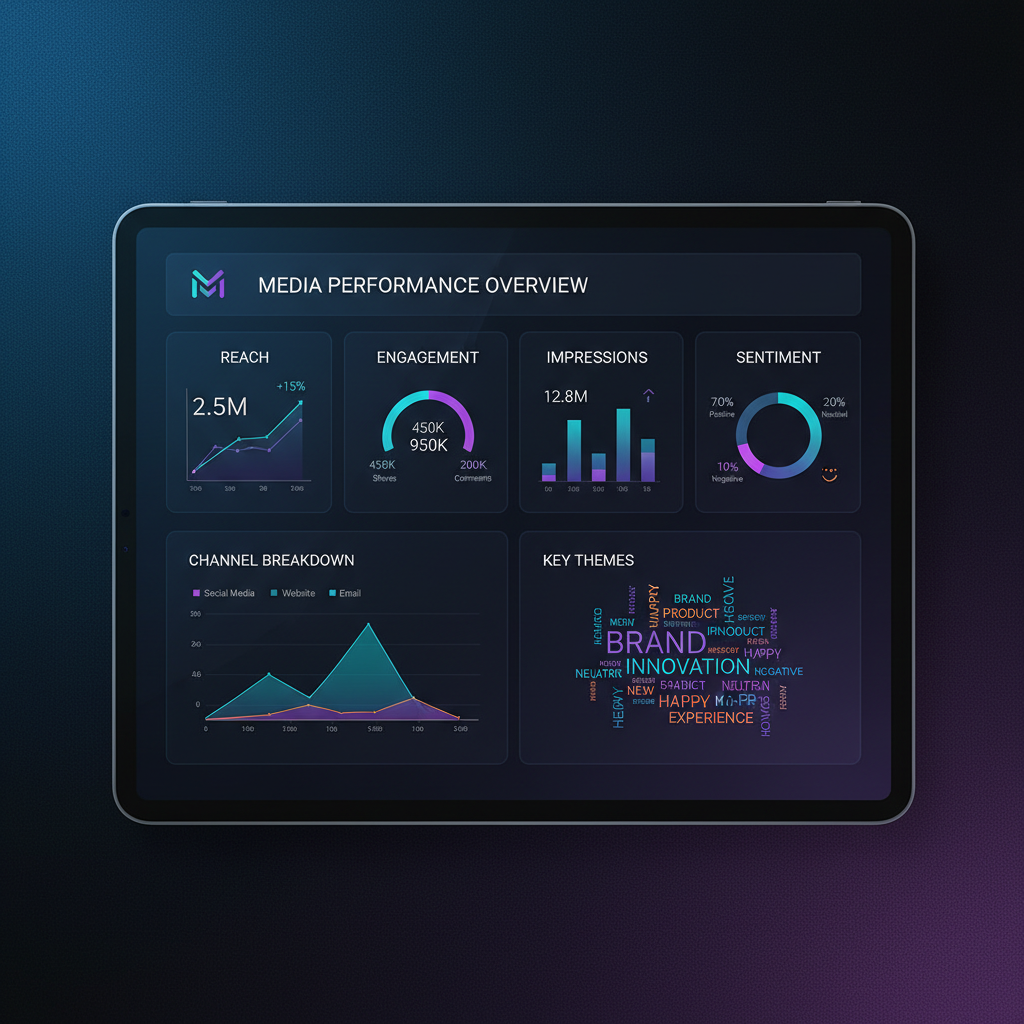
Presenting Findings with Charts or Graphs
Visual representation makes complex data easier to understand and retain:
- Bar charts for comparing values across channels
- Pie charts for proportion breakdowns
- Line graphs for trends over time
Always label axes and legends clearly. Use color coding to highlight positive and negative trends.
---
Review and Edit for Accuracy and Readability
A report riddled with errors loses credibility. Best practices include:
- Fact-checking data points
- Proofreading for typos and grammar issues
- Simplifying sentences without losing meaning
- Ensuring visuals match the data
If possible, have a colleague review the report before finalizing.
---
Sample Media Report Walkthrough: Section by Section
Let’s break down a media report example:
Title Page
Includes: Q1 Media Performance Report, Prepared by Marketing Team, For ABC Corporation, dated April 2024.
Executive Summary
- Campaign reach exceeded targets by 15%.
- Engagement rates rose from 4% to 5.4%.
- Positive sentiment increased from 65% to 72%.
Body Sections
- Social Media Performance: Data from Facebook, Instagram, Twitter, broken into reach, impressions, engagement.
- Press Coverage: Summary of news articles, blogs, interviews.
- Website Metrics: Increase in referral traffic from PR campaigns.
Conclusion
- Optimizing content frequency led to improved engagement.
- Recommendation: Increase investment in Instagram ads.
---
Common Mistakes to Avoid in a Media Report
- Overloading with raw data: Present only relevant metrics.
- Ignoring audience needs: Tailor the report’s detail level.
- Neglecting visuals: Data without visuals can be harder to interpret.
- Inconsistent formatting: Keep heading styles, font sizes, and table formats consistent.
- Lack of context: Numbers alone are meaningless without explanation.
---
Final Checklist Before Publishing or Sending
Before finalizing your media report:
- ✅ Title page with clear labeling
- ✅ Executive summary
- ✅ Accurate, validated data
- ✅ Appropriate visuals for key data points
- ✅ Clear, concise writing in active voice
- ✅ Proofread and peer-reviewed
- ✅ Recommendations aligned with findings
---
Conclusion and Next Steps
Media reports are essential for transparently communicating the results of media initiatives. By following these formatting guidelines, structuring your document effectively, and focusing on clarity, you set the stage for impactful decision-making. The media report example and walkthrough provided here can serve as a blueprint for creating professional, data-driven reports tailored to your audience and goals.
For your next media project, use this guide as a checklist to ensure every section—from data gathering to conclusions—is presented in a compelling, well-structured format. Start implementing these best practices now to elevate the quality and influence of your reporting.