Number of Times per Week as Discrete Quantitative Data
Learn why “number of times per week” is classified as discrete quantitative data, its statistical properties, and best practices for accurate collection.

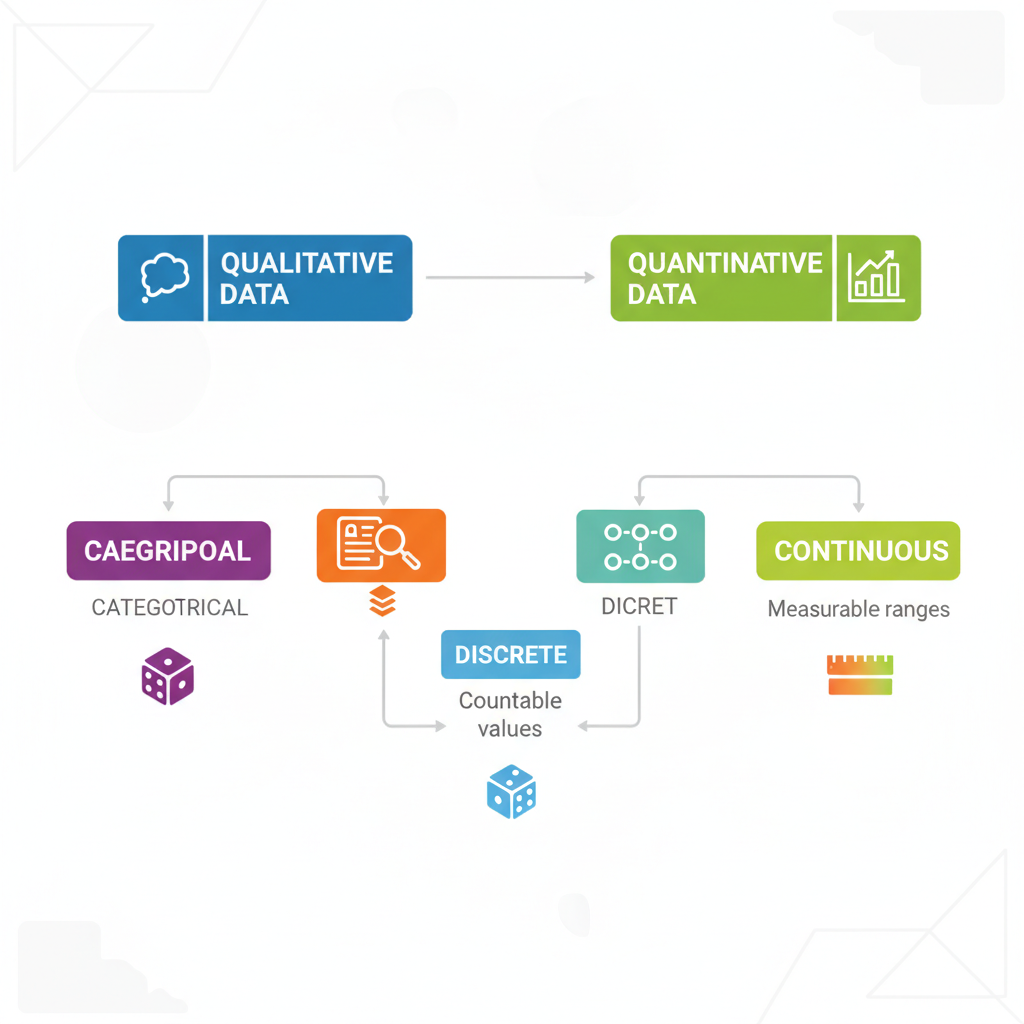
Understanding Data Types: Qualitative vs Quantitative
When collecting and analyzing statistics, one of the most common variables measured is "number of times per week". Correctly identifying its type is essential for accurate statistical techniques and meaningful insights. This starts with understanding the differences between qualitative and quantitative data.
- Qualitative Data (categorical): Categories, labels, or qualitative attributes such as eye color, brand preference, or favorite genre.
- Quantitative Data (numerical): Measurements, counts, or quantities that can be mathematically analyzed.
Quantitative data can be further divided into discrete or continuous formats — the key distinction for determining where "number of times per week" belongs.
---
Discrete vs Continuous Data in Statistics
Discrete Data
Discrete data consists of countable values. Each can be listed separately, with no meaningful intermediate values between counts. Examples include:
- Number of children in a family
- Goals scored in a match
- Number of times per week a person exercises
Continuous Data
Continuous data can take on any value within a range, often including fractions and decimals. Measurements like height, weight, or temperature are continuous because they can assume infinitely many possible fractional values.
Understanding this separation helps determine the most effective statistical techniques for analysis.
---
"Number of Times per Week" — A Clear Case of Discrete Quantitative Data
The question "Number of times per week is what type of data?" has a straightforward answer: discrete quantitative data.
Reasons include:
- Numeric nature — it records counts of occurrences.
- Discrete property — values are whole numbers (0, 1, 2, 3 …). Fractions only occur in averages across groups.
- Mathematical usability — sums, means, and differences are meaningful.
Statistically, this is count data, often modeled using distributions like Poisson or binomial in research.
---
Practical Examples in Surveys and Research
Survey Example
A healthy eating survey might ask:
> "How many times per week do you eat vegetables?"
Possible answers:
- 0 times
- 1–2 times
- 3–4 times
- 5 or more times
Research Example
In a fitness tracker study:
- Number of gym visits per week per participant.
- Number of times per week a patient takes prescribed medication.
Both are whole-number counts, making them discrete quantitative variables.
---
Differences Between Frequency Data and Categorical Data
It’s important not to confuse numeric frequency counts with categorical measures.
| Feature | Frequency Data (Discrete Numeric) | Categorical Data |
|---|---|---|
| Nature | Numeric counts of occurrences | Labels or categories |
| Example | Number of times per week reading | Favorite book genre |
| Statistical Analysis | Means, medians, regression | Chi-square, proportion analysis |
| Scale | Ratio scale (zero means none) | Nominal or ordinal |
---
Count Data vs Interval or Ratio Misunderstandings
“Number of times per week” exists on a ratio scale:
- Absolute zero — 0 times means no occurrences.
- Meaningful ratios — 4 times is twice as much as 2 times.
It is not interval data, which often has arbitrary zeros (e.g., temperature in Celsius) and focuses on differences rather than proportional relationships.
---
How to Collect "Times per Week" Data
Common Methods
- Self-reported surveys — participants enter numbers or ranges.
- Automated tracking — devices or apps log occurrences directly.
- Observation — researchers count behaviors in the field.
Accuracy Tips
- Clearly define the time frame (“in the past 7 days”).
- Specify what counts as an occurrence.
- Avoid vague words like “regularly” or “often.”
---
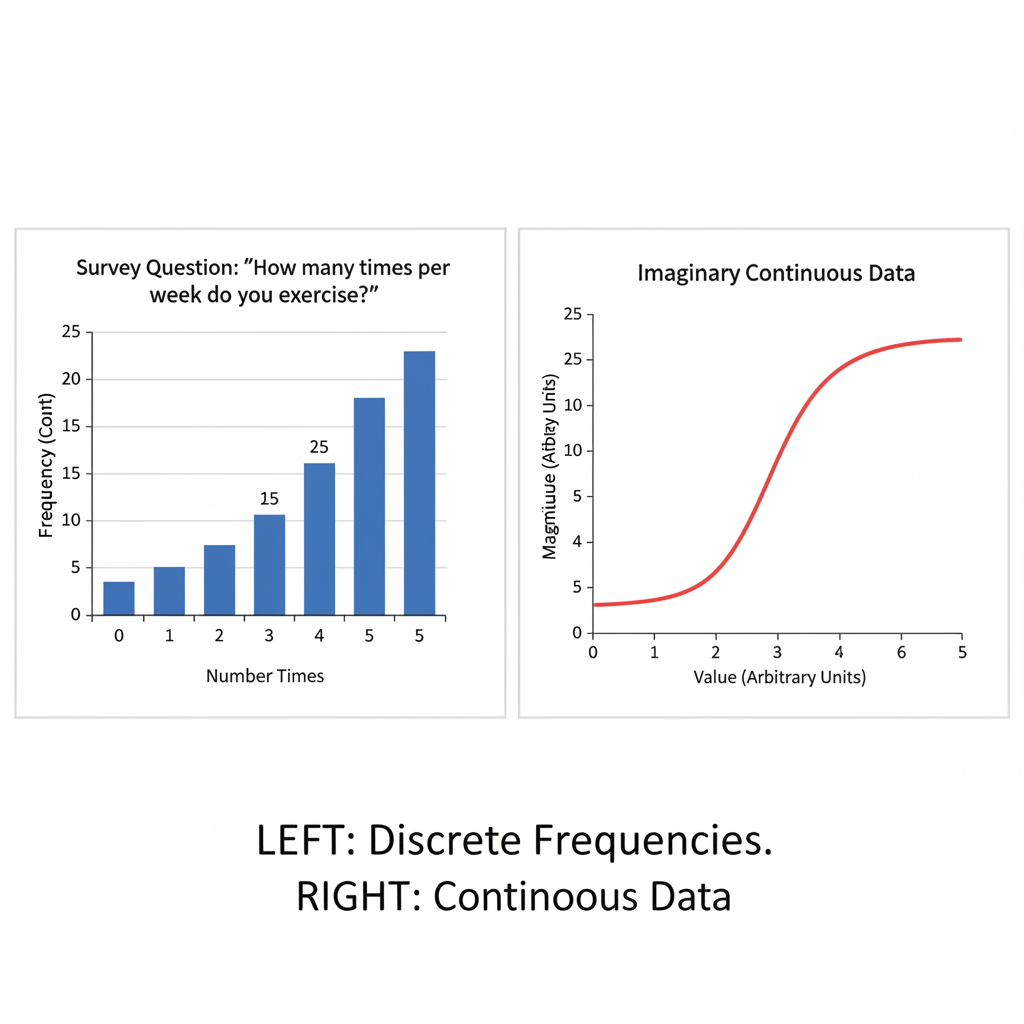
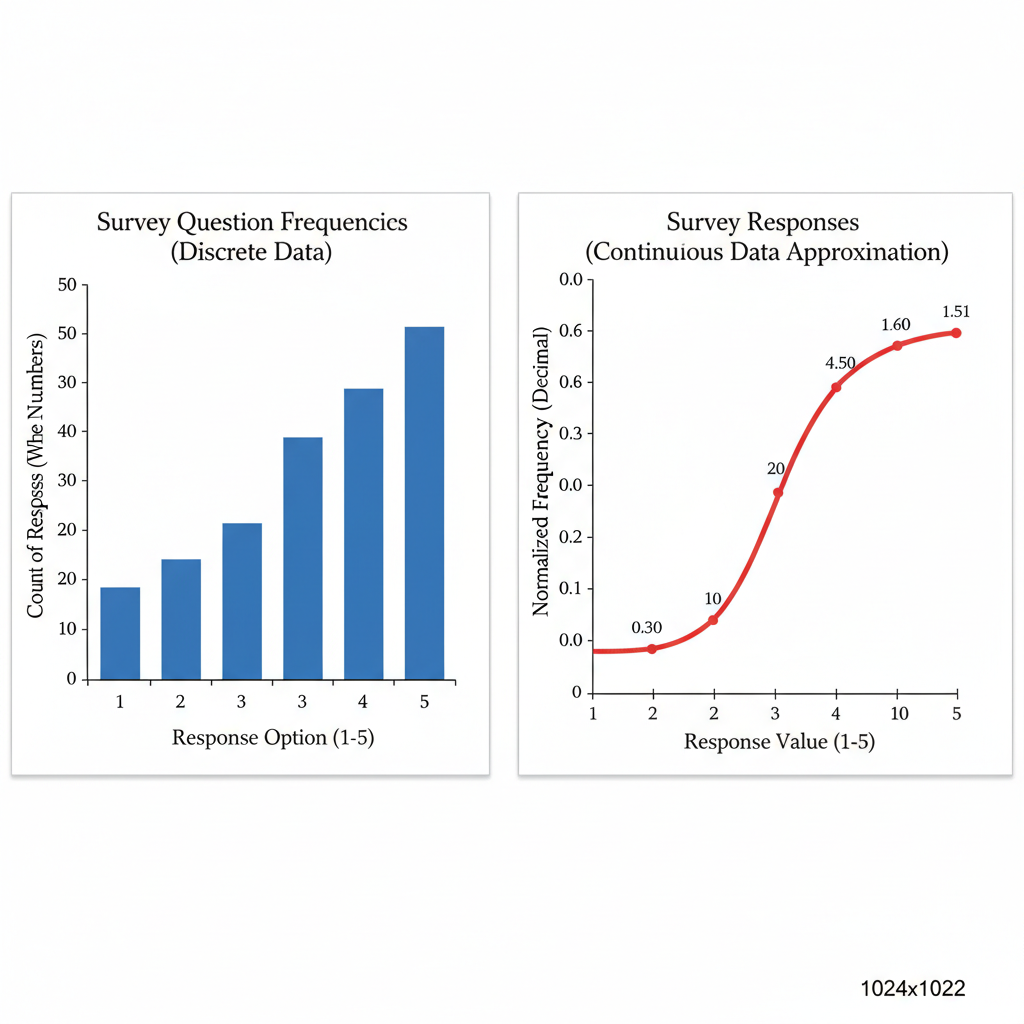
Visualizing Discrete Frequency Data
Because this variable is discrete, certain visualization techniques are optimal:
Bar Charts
Show the count for each reported frequency level.
Histograms
Useful when counts are numerous, offering a distribution view.
Frequency Tables
Summarize values with corresponding occurrence counts:
| Times per Week | Number of Respondents |
|---|---|
| 0 | 15 |
| 1 | 22 |
| 2 | 30 |
| 3 | 18 |
| 4 | 10 |
---
Limitations and Measurement Challenges
Even straightforward count questions can yield unreliable results due to:
- Recall bias — memory inaccuracies.
- Social desirability bias — exaggerated positive or minimized negative activity reports.
- Ambiguous definitions — uncertainty on what counts as “one time.”
---
Best Practices for Question Design
For better quality data:
- Use direct wording: “In the past week, how many times did you visit the gym?”
- Define the counted activity clearly.
- Encourage numeric entries over vague terms.
- Reserve ranges for genuine grouping needs.
- Pilot test to pinpoint interpretation issues.
---
Conclusion and Next Steps
The "number of times per week" variable is discrete quantitative count data on a ratio scale. Its discrete nature lies in the whole-number counts, and ratio-level measurement allows meaningful comparisons.
From health surveys to user-engagement analytics, recognizing this classification ensures the right statistical tools are used — whether a simple bar chart or Poisson regression. By following rigorous design and collection practices, you can minimize bias and improve the reliability of your data.
Summary:
Correctly classifying "number of times per week" as discrete quantitative data ensures more accurate analyses and stronger insights. Apply clear definitions, reliable collection methods, and robust visualizations to get the most value from your frequency data.
Call to Action:
When designing your next survey or study, define “times per week” precisely and choose statistical methods aligned with its discrete, ratio-scale nature to achieve dependable results.