Post Engagement Playbook: Proven Strategies, Benchmarks, and Tactics to Lift Likes, Comments, Shares, and Saves
Boost likes, comments, shares, saves, and watch time with this post engagement playbook: platform-specific signals, benchmarks, formulas, and testable tactics.

Post Engagement Playbook: Proven Strategies, Benchmarks, and Tactics to Lift Likes, Comments, Shares, and Saves

This playbook organizes the essentials of post engagement into a practical, platform-aware reference. You’ll find how algorithms weigh signals, how to measure what matters, and which formats and workflows reliably lift saves, shares, comments, and watch time. Use it to diagnose current performance, set clear benchmarks, and run disciplined experiments that compound results.
What “post engagement” really means and why it matters
“Post engagement” is the sum of meaningful actions people take on your content. Core actions you should track:
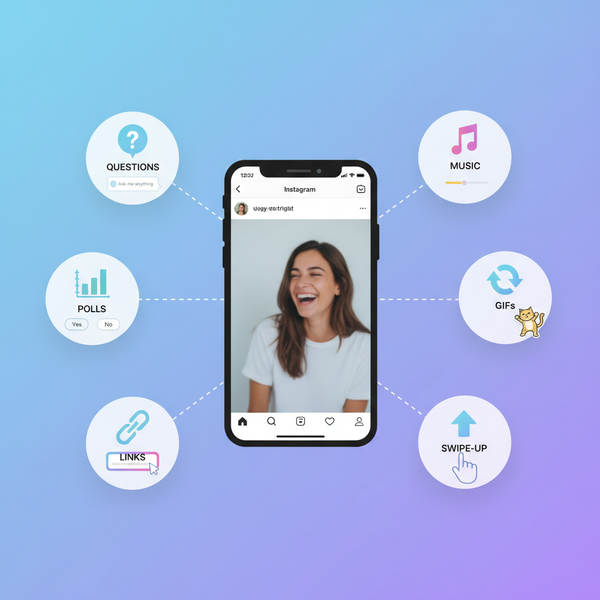
- Visible interactions: likes, reactions, comments, shares, quote posts, saves, retweets/reposts
- Intent signals: link clicks, profile taps, follows from post, DMs initiated from post, story replies
- Watch behaviors: rewatches, completion rate, dwell time, average view duration, retention curve
Why it matters:
- Algorithmic reach: Platforms reward content that keeps users engaged with more distribution in feeds, For You pages, and recommendations.
- Brand recall and consideration: Comments and shares indicate deeper processing and social proof, boosting memory and trust.
- Lead and revenue quality: Saves, link clicks, and DMs map closely to mid-to-bottom funnel intent and conversion propensity.
- Feedback loop: Engagement patterns surface what resonates, guiding creative direction and product positioning.
Quality over quantity: 100 thoughtful comments and saves can outperform 10,000 passive likes in both reach and revenue impact.
---
How algorithms weight engagement across platforms
Each platform optimizes for session time and user satisfaction, favoring quality signals over vanity counts.
- Strong signals: saves, shares (especially DM shares), profile taps, post replays, time spent on post, meaningful comments
- Secondary: likes, non-meaningful comments (emojis), hashtags
- Implication: Design for saves and shares with utility (how-tos, checklists, reference carousels)
- TikTok
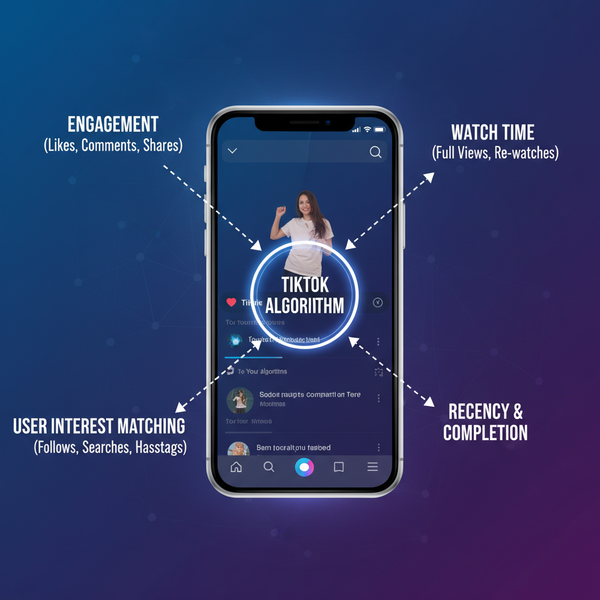
- Strong signals: rewatches, completion rate, average watch time, rapid engagement velocity, favorites, shares
- Secondary: likes, comments with low depth
- Implication: Hook in first 2 seconds, tight pacing, payoff moments to earn rewatches
- Strong signals: dwell time (read time), meaningful comments, reshares, clicks to “see more,” document post page flips
- Secondary: reactions, likes
- Implication: Lead with a compelling first line; prompt substantive replies
- YouTube
- Strong signals: CTR on thumbnail/title, average view duration (AVD), percentage viewed, audience retention, session starts, returning viewers
- Secondary: likes, comments, shares
- Implication: Thumbnails and titles set discovery; content structure sustains retention
- X (Twitter)
- Strong signals: replies, quote posts, profile visits, link clicks, dwell time on threads
- Secondary: likes, retweets without comment
- Implication: Ask compelling questions, write replyable takes, thread with cadence
Key idea: Platforms distinguish meaningful, session-extending interactions from low-effort vanity signals. Optimize creative and prompts for the former.
---
Measuring engagement correctly
Core formulas
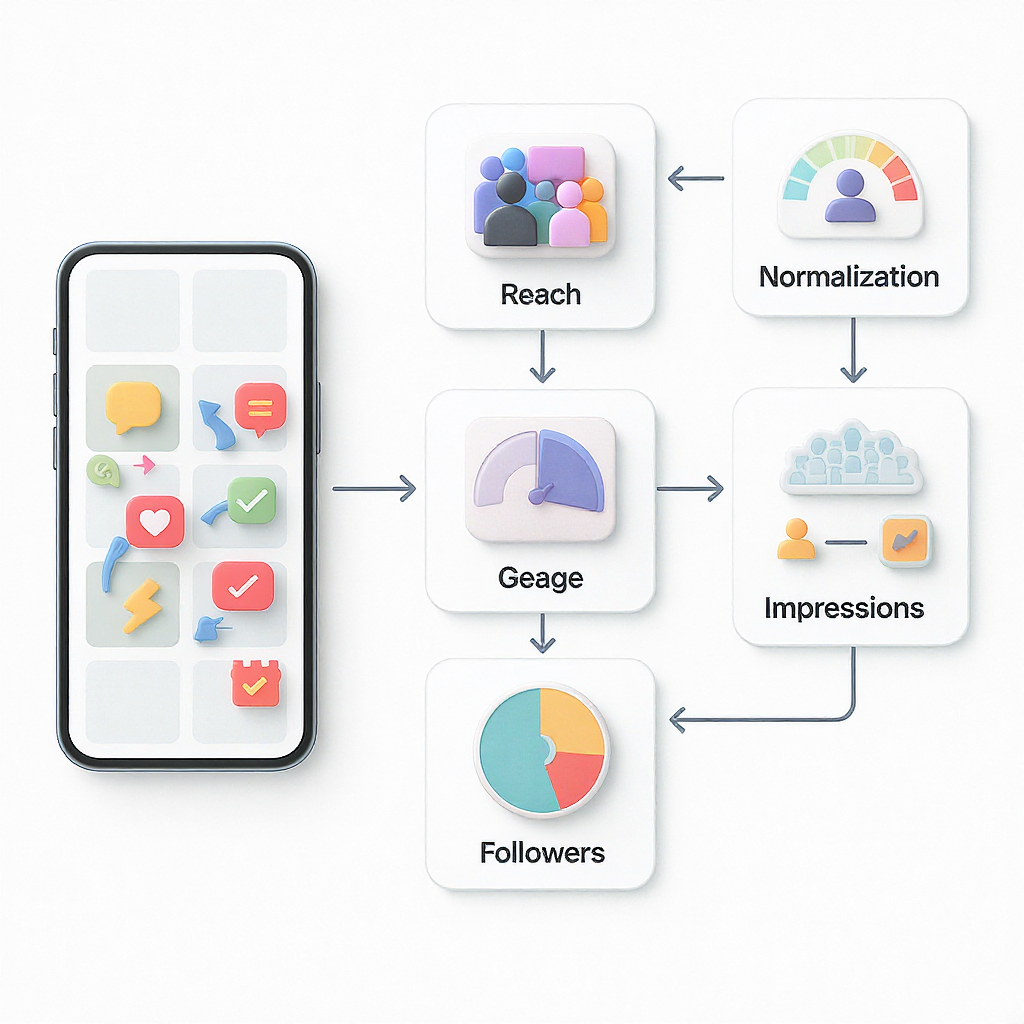
Use the denominator that best matches your distribution model and objective.
Engagements = Likes + Comments + Shares/Retweets + Saves + Clicks + (Optional: Profile Taps, DMs)- Engagement Rate by Reach (ERR)
- Use when reach is available and variable (Instagram, Facebook). Best for creative testing.
- Engagement Rate by Impressions (ERImpr)
- Use on platforms that report impressions prominently (LinkedIn, X). Stable across posts with multiple exposures.
ERImpr = (Engagements / Impressions) * 100ERR = (Engagements / Reach) * 100- Engagement Rate by Followers (ERF)
- Use for high-level reporting over time; not ideal for post-level comparisons as reach varies widely.
- Video Completion Rate (VCR)
VCR = (Completed Plays / Video Starts) * 100ERF = (Average Post Engagements / Followers) * 100- YouTube CTR
- Average View Duration (AVD)
AVD = Total Watch Time / ViewsCTR = (Thumbnail Clicks / Impressions) * 100When to use which
- Creative A/B testing: ERR (or ERImpr) to normalize for distribution.
- Channel health over time: ERF paired with follower growth and reach/follower ratio.
- Video optimization: CTR + AVD + Retention curve, not just likes/comments.
Pitfalls with small sample sizes
- Volatility: A post with 150 reach and 10 engagements shows 6.7% ERR—looks great but is unstable. Set minimum reach thresholds (e.g., exclude posts under 500 reach) for comparisons.
- Outliers: Viral posts skew averages. Use medians and 20th–80th percentile ranges.
- Denominator drift: Comparing ERF across months with big follower changes can mislead. Triangulate with reach/follower and impressions/follower.
Practical benchmarks and SMART goal-setting
Benchmarks vary by niche and quality. Use these directional ranges as starting points:
| Platform | Typical ER Metric | Consumer Brands | SaaS/B2B | Creators/Education |
|---|---|---|---|---|
| ERR | 1.5–5% | 0.8–3% | 2–6% | |
| TikTok | Engagements / Views | 5–18% | 3–12% | 6–20% |
| ERImpr | 0.8–2% | 1–3% | 1.5–4% | |
| YouTube | (Likes+Comments+Shares)/Views | 0.5–1.5% | 0.3–1.2% | 0.8–2% |
| X (Twitter) | ERImpr | 0.5–1.2% | 0.4–1.0% | 0.6–1.5% |
Set SMART goals tied to funnel KPIs:
Specific: Lift Instagram saves/post by 30% (from 40 to 52) on educational carousels
Measurable: Track saves and ERR for carousel posts weekly
Achievable: Add checklists + summary cards + “Save for later” CTA
Relevant: Saves correlate with 22% higher newsletter signups from bio link
Time-bound: Achieve within 6 weeks
---
Content formats that earn interactions
Platform-specific winners:
- Carousels with frameworks, step-by-steps, before/after, checklist slides
- Reels with quick payoff hooks, transitions, captions on-screen
- Story polls/quizzes; Guides to bundle evergreen posts
- TikTok
- “Do this, not that” tips, POV demos, duets/stitches, myth-busting
- Series with episodic hooks: “Part 2 drops tomorrow—follow to catch it”
- Document posts (carousel PDFs), case study threads, opinionated takes with data
- Polls sparingly with a debate question; employee spotlights and UGC
- YouTube
- How-to tutorials, teardown case studies, comparison reviews, shorts as top-of-funnel
- X (Twitter)
- Structured threads (hook -> context -> steps -> examples -> takeaway)
- Polls that seed debate; quote-tweet commentary on industry news
Copy frameworks:
- Hooks
- “Most [role] lose [X] to [problem]. Fix it in 3 steps.”
- “I wasted $10k learning this so you don’t have to…”
- Open loops
- Hint at the payoff and close it at the end or in a follow-up post
- CTAs
- Saves/shares: “Save this checklist for next time” / “Send this to your team”
- Comments: “Which step is hardest?” / “What did I miss?”
- Clicks: “Full template linked in bio/reply”
Creative best practices:
- Thumb-stopping first 2 seconds: motion, pattern interrupt, bold claim, first-frame text
- Clear hierarchy: large headline, concise subtext, one focal image
- Brand cues: consistent color, type, and logo in corners; make it recognizable in 0.3s
- Mobile-first: safe zones, subtitles, 1080x1350 for IG, 9:16 for short-form
---
Accessibility and inclusivity that boost engagement
- Alt text: Describe key information and context, not just “image of chart.” Improves search and accessibility.
- On-video captions: Hardcode or upload SRT; many users watch muted. Captions raise retention and completion.
- Readable contrast: WCAG-compliant contrast ratios; larger font for mobile small screens.
- Localized variants: Translate captions/subtitles for priority markets; reflect local idioms.
- Inclusive imagery: Represent diverse ages, abilities, ethnicities; avoid stereotypes.
Impact: Accessible content reduces friction, increases watch time, boosts shares (users can comfortably send content to others), and expands total addressable audience.
---
Timing, cadence, and calendar design
Data-led posting windows:
- Use native analytics to identify follower online times; test 2–3 slots per daypart (morning commute, lunch, evening).
- Consider audience time zones; schedule for the largest cohort.
Frequency without fatigue:
- Instagram/TikTok: 3–7 feed posts/Reels per week; Stories as needed
- LinkedIn: 3–5 posts per week; documents 1–2x
- YouTube: 1–2 long-form videos per week; 2–5 Shorts
- X: 1–3 threads + 5–10 lightweight posts/replies daily if resourced
Seasonality and content mix:
- Balance evergreen (60–70%) with trend-jacking (30–40%)
- Lean into seasonal spikes: buying cycles, events, industry launches
Simple weekly content calendar with repurposing loops:
| Day | Pillar Theme | Primary Format | Draft Hook | Primary CTA | Repurpose To |
|---|---|---|---|---|---|
| Mon | Education | IG Carousel | “3 mistakes killing your [metric]” | Save/Share | LinkedIn Document + X Thread |
| Tue | Proof | Case Study Reel | “We 3x’d [KPI] in 28 days—here’s the play” | Comment question | TikTok edit + YouTube Short |
| Wed | Community | LinkedIn Opinion Post | “Unpopular truth about [topic]” | Reply with experiences | Podcast clip + IG Story poll |
| Thu | Product | YouTube Tutorial | “Set up [feature] in 7 minutes” | Click to guide | Blog embed + Email snippet |
| Fri | UGC/Advocacy | Customer Highlight | “How [user] solved [pain]” | Tag a teammate | IG Reel remix + LinkedIn carousel |
---
Community building and conversation design
Prompt engineering for comments:
- Ask narrow, experience-based questions: “What’s the one report you check first every Monday?”
- Use forced-choice prompts: “A or B? Why?”
- Invite stories: “When did this go wrong for you, and what changed?”
Reply playbooks:
- Respond within the first hour to seed depth; ask a clarifying follow-up in replies
- Tag relevant teammates or creators to widen the thread
- Summarize top comments in a follow-up post and credit contributors
Moderation with brand voice:
- Publish a visible community guideline summary
- Hide spam; respond to critique with curiosity, not defensiveness
- Escalate sensitive issues to DM; acknowledge publicly
Leverage UGC and micro-influencers:
- Create UGC prompts (“Show your setup”); feature top entries weekly
- Micro-influencer collabs with co-created assets and cross-posts
- Employee advocacy kits: pre-approved talking points, asset folder, sample posts
Handling negativity without tanking sentiment:
- Separate signal from noise; thank for feedback, correct misinformation calmly
- Move heated threads to private channels; recap resolution later (transparency wins trust)
---
Social SEO and discovery levers
- Keyworded captions: Write like a search query answer. Front-load key phrases.
- Hashtag frameworks: 3–5 relevant, specific tags; avoid generic spammy clouds.
- Topic tags: Use platform topic categories (e.g., LinkedIn topics, YouTube tags lightly).
- Alt text for search: Include keywords naturally; reflect chart labels and conclusions.
- Geotags where relevant: Local discovery matters for events and brick-and-mortar.
- TikTok/IG search behavior: Users search “how to X” and “best Y near me.” Title first-frame text accordingly; verbalize the keyword in the first 3 seconds for auto-captions to catch it.
---
Experimentation and analytics workflow
A/B test hypotheses:
- Variables: hook (claim vs question), format (carousel vs reel), length (15s vs 30s), CTA (comment vs save), thumbnail/title variants
- Test one major variable at a time; run for statistically meaningful reach
Hypothesis template:
If we use a first-frame checklist + “Save for later” CTA on IG carousels,
then saves/post will increase by 25%,
because checklists create utility and the CTA makes the action explicit.
Success criteria: +25% saves at ≥1,000 reach per post across 5 posts.
Reading retention and heatmaps:
- YouTube: Use audience retention to find drop-off moments; add pattern breaks before dips
- IG/TikTok: Watch 3s/10s hold metrics; identify frames that cause skips
- LinkedIn documents: Page-turn rates; add scannable headlines every page
Cohorting by audience segment:
- Segment performance by geography, industry, seniority, and follower vs non-follower
- Tailor hooks and examples to top-performing segments
Tools stack:
- Native analytics (IG Insights, TikTok Analytics, LinkedIn, YouTube Studio, X Analytics)
- GA4 for downstream behavior; UTM parameters for link tracking
- Social schedulers with A/B and best-time features (e.g., Later, Buffer, Sprout)
- Lightweight editing and captioning (CapCut, Descript); thumbnail tools (Figma, Canva)
Monthly learning agenda:
- Pick 2–3 focused questions (e.g., “Do how-to carousels outperform checklists for saves?”)
- Ship 10–15 controlled tests
- Review panel: summarize learnings, update playbooks, sunset underperformers, double-down on proven patterns
---
Paid + organic synergy and pitfalls
Make paid dollars compound your organic post engagement, not replace it.
- Boost proven winners: Only promote posts already in your top quartile for ERR/retention
- Engagement retargeting: Create audiences of engagers (video viewers, savers, clickers) for down-funnel ads
- Lookalikes: Seed with high-intent engagers (savers, add-to-cart, long-viewers) rather than page fans alone
- Creator whitelisting/spark ads: Run paid through creator handles to preserve social proof and feed distribution
- Budget pacing: Test with small daily budgets; monitor frequency to avoid fatigue
- Compliance/brand safety: Exclude sensitive placements; clear rights for UGC
Pitfalls to avoid:
- Engagement bait: “Comment YES!” hurts quality signals and credibility
- Clickbait: Misleading thumbnails/titles spike CTR then crater retention—algos punish this
- Giveaway-only growth: Attracts prize chasers; low long-term engagement and conversion
- Fake followers: Damages reach ratios and trust; hard to recover
Quick wins checklist:
- Add “Save this” and “DM this to a colleague” CTAs to utility posts
- Front-load hooks in first-frame text and first 2 seconds of video
- Standardize alt text and on-video captions
- Repurpose top posts cross-platform with native edits (size, caption style)
- Reply within 60 minutes to seed meaningful comment threads
- Test 2 thumbnails/titles per YouTube video; keep promises congruent
- Use UTMs everywhere; review GA4 assisted conversions from social
- Build an “Engagers last 90 days” retargeting audience and test a nurture ad
- Publish a weekly insights recap to the team; update the playbook monthly
---
Final thought
Post engagement is not a vanity scoreboard—it’s a map of attention, intent, and value exchange. Align creative to quality signals, measure with the right denominators, design for accessibility and dialogue, and run a disciplined testing cadence. The compounding result: algorithmic reach, deeper community, and measurable revenue outcomes.
Summary
This guide clarifies which engagement signals matter on each platform, how to measure them accurately, and which content formats and workflows consistently lift performance. Use the benchmarks to set SMART goals, the calendars and prompts to systematize output, and the experimentation framework to iterate with intent. Stay focused on meaningful, session-extending actions to earn sustainable reach and impact.