Post Ideal: A Data-Backed Blueprint for the Ideal Blog and Social Media Post
A data-backed blueprint to plan, write, and optimize blog and social posts. Learn anatomy, benchmarks, platform nuances, and how to measure and iterate.

Creating an “ideal” post is less about a single formula and more about a repeatable, testable system aligned to a specific goal on a specific channel. This guide provides a structured blueprint—covering anatomy, benchmarks, intent, platform nuances, and measurement—so you can build, ship, and iterate with confidence. Treat it as a modular reference you can adapt to blogs and major social platforms.
Post Ideal: A Data-Backed Blueprint for the Ideal Blog and Social Media Post

The “post ideal” is not a single formula—it’s a disciplined process that aligns messaging, structure, and timing to the specific outcome you want on each channel. Whether you’re publishing a long-form blog, a LinkedIn carousel, or a TikTok, the ideal post is the one that predictably advances your goal: reach, engagement, or conversions. This guide lays out a practical, data-backed blueprint you can adapt and test.
What “Post Ideal” Really Means
The post ideal is the best version of a post for a defined outcome, in a defined context. It changes based on:
- Goal: reach (impressions), engagement (comments, shares, saves), or conversions (leads, trials, sales).
- Audience: their intent, attention span, pain points, and platform behavior.
- Channel norms: length, tone, media formats, and algorithm signals.
You cannot optimize for every metric at once. Pick a primary objective and a north-star metric, then structure the post to serve that one thing.
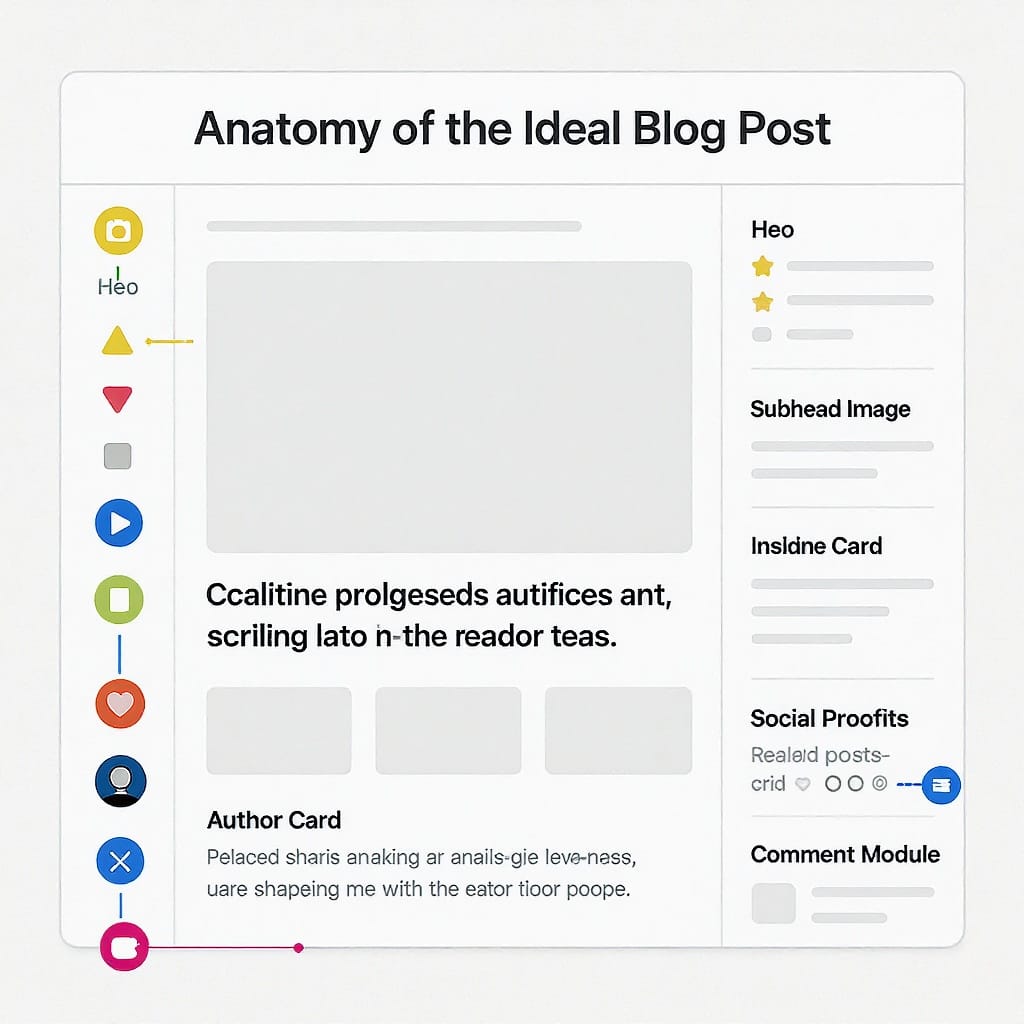
Anatomy of the Ideal Post
Every platform rewards clarity and value density. A dependable skeleton:
- Headline and hook
- Promise a specific outcome or insight.
- Make the first line pass the “scroll test.”
- Structure
- Problem: name the pain or desire.
- Value: show the solution or insight.
- Proof: examples, data points, social proof.
- CTA: one clear next step.
- Scannability
- Subheads, short paragraphs, bullets, and white space.
- Bold the key phrase or number (within platform style constraints).
- Single CTA
- One ask per post: click, comment, save, subscribe, or share.
Tip: Draft long for clarity, then edit for sharpness. The post ideal is often 20–30% shorter than your first pass.
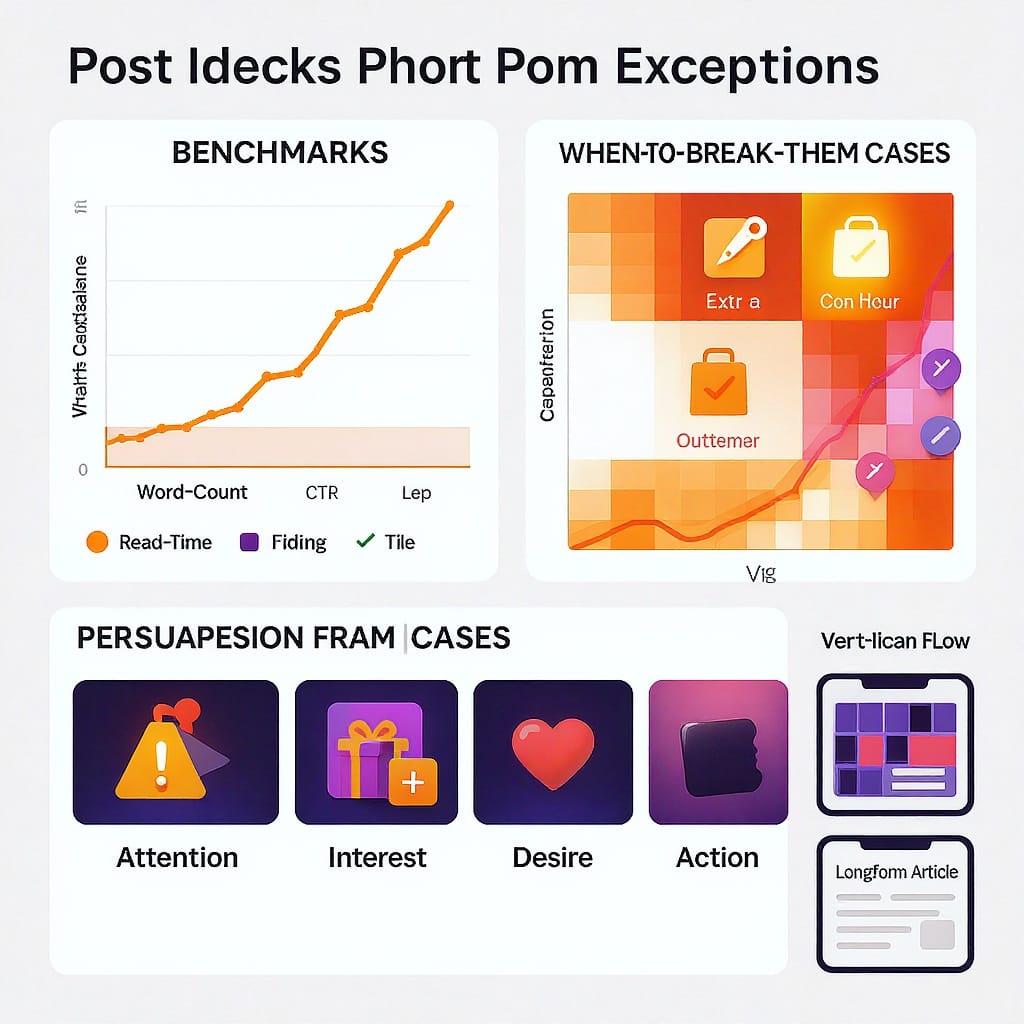
Data Benchmarks to Aim For (And When to Break Them)
Use benchmarks to set a starting line, not a finish line. Then run audience-specific tests.
| Channel | Length Starting Point | Hashtags/Keywords | Posting Window (Local Time) | Primary Goal Fit |
|---|---|---|---|---|
| Blog | 1,200–2,000 words for depth; 600–900 for quick hits | N/A; focus on semantic coverage and internal links | When your audience researches (weekday mornings) | Organic search, email opt-ins |
| 100–220 words caption; carousels 6–10 slides | 3–5 hashtags; 1–2 branded | Tue–Thu, 8–11am or early afternoon | Reach, B2B engagement | |
| X/Twitter | 1–2 tweets; threads 5–8 tweets | 1–2 hashtags; keywords in text | Weekdays, commute/lunch hours | Conversation, rapid reach |
| Caption 80–150 words; carousels 6–10 slides; Reels 5–15s | 3–5 relevant hashtags; keywords in caption | Evenings and weekends; test by segment | Saves, shares, brand affinity | |
| TikTok | Video 7–20s; hook in 1s; caption to support keywords | Keywords in caption and on-screen text; a few tags | Post multiple times; consistency > single slot | Discovery, top-funnel reach |
When to break them:
- If completion rate drops on video, make it shorter—even if averages say longer.
- If your audience prefers long reads (e.g., technical buyers), push blog depth past 2,500 words with strong subheads.
- If your posts drive DMs or replies but fewer likes, keep the format that drives the business outcome.
Search Intent and SEO for Blog Posts
Search-driven posts must satisfy intent fast and thoroughly.
- Map intent
- Primary keyword aligns with primary intent (informational, transactional, navigational).
- Secondary keywords cover adjacent subtopics and FAQs.
- Semantic coverage
- Include entities, synonyms, and related concepts naturally.
- Use subheads to mirror how users decompose the topic.
- Internal linking
- Link up to cornerstone pages and laterally to related posts.
- Use descriptive, intent-rich anchor text.
- EEAT signals
- Author bio with credentials, outbound citations, updated date.
- Specifics > generalities; show firsthand experience where possible.
- Schema basics
- Use Article or HowTo schema to enhance snippets.
- Satisfy intent fast
- Provide a crisp summary or answer within the first 100–150 words.
- Add a TL;DR box if the topic is long.
Example Article schema (JSON-LD):
{
  "@context": "https://schema.org",
  "@type": "Article",
  "headline": "Post Ideal: A Data-Backed Blueprint",
  "author": {
    "@type": "Person",
    "name": "Your Name"
  },
  "datePublished": "2025-09-16",
  "image": ["https://example.com/hero.jpg"],
  "mainEntityOfPage": "https://example.com/post-ideal-blueprint",
  "description": "A practical framework for creating the ideal blog and social posts."
}
Platform-Specific Best Practices
Match tone, length, and media to each platform’s native distribution patterns.
| Platform | Tone | Ideal Length | Formats | Hooks | Native Boosters |
|---|---|---|---|---|---|
| Blog | Authoritative, helpful | 1,200–2,000 words | Text, images, code, tables | Outcome-first H2 + clear lead | Internal links, schema, TOC |
| Practical, credible | 100–220 words | Text posts, carousels, docs | Polarizing insight or data point | Carousels, native docs, tagging | |
| X/Twitter | Concise, conversational | 1–2 tweets | Threads, images, quote-tweets | Contrarian or curiosity gap | Replies, lists, bookmarks |
| Visual, emotive | 80–150 words | Carousels, Reels, Stories | Before/after, step-by-step | Audio trends, collabs, alt text | |
| TikTok | Fast, entertaining | 7–20 seconds | Short video, text overlays | Show outcome in 1 second | Captions, sounds, native edit |
Persuasion Frameworks That Lift Response
Blend classic frameworks to increase clarity and reduce friction.
- AIDA: Attention, Interest, Desire, Action
- Use the first line for Attention, the first subhead for Interest.
- PAS: Problem, Agitation, Solution
- Agitate with a specific failure mode; resolve with a concrete step.
- 4U headlines: Useful, Unique, Urgent, Ultra-specific
- Example: “The 7-step post ideal checklist to double your saves this month.”
- Social proof and credibility
- Numbers, named clients, testimonials, or third-party data.
- Novelty vs. clarity
- Lead with novelty (pattern break), deliver with clarity (plain language).
- Reduce friction
- One CTA, low-commitment micro-asks (save, comment), and obvious next steps.
Visuals That Do the Heavy Lifting
Visuals accelerate comprehension and retention.
- Hero images: reinforce promise; avoid generic stock when possible.
- Carousels: teach one idea per slide; front-load value.
- Short clips: show outcome first, then how you got there.
- Thumbnails: high contrast, 3–5 words max, face/gesture if brand-appropriate.
- Alt text: describe purpose, not just contents; include key terms naturally.
- Brand consistency: restrained palette, repeatable layouts, legible type.
- Accessibility: captions, transcripts, sufficient contrast, no text-only color cues.
Cadence and Timing
Consistency beats occasional bursts. Build a system.
- Editorial calendar
- Plan themes by week/month; map goals and KPIs per post.
- Batching and repurposing
- Draft once, ship many: blog → LinkedIn carousel → X thread → Reel/TikTok → email summary.
- Evergreen vs. timely
- Split backlog into durable pillars and fast takes; keep 70–80% evergreen if you need compounding returns.
- Timing tests
- Start with benchmark windows, then:
- Post at 3–4 different slots per weekday for 2–3 weeks.
- Compare impressions per follower and engagement rates.
- Lock the best two slots; revisit quarterly as audience shifts.
Measurement and Optimization Loop
Define success per channel and iterate tightly.
- KPIs by goal
- Reach: impressions/unique viewers per post.
- Engagement: saves, shares, comments, profile clicks.
- Consumption: dwell time, read % (blog), video retention curve.
- Conversion: CTR, sign-ups, trials, purchases.
- UTM discipline
- Tag every link to attribute outcomes.
Example UTM:
https://example.com/post-ideal?utm_source=linkedin&utm_medium=social&utm_campaign=post_ideal_launch&utm_content=carousel_v1- A/B testing
- Headlines: test curiosity vs. clarity.
- Thumbnails: face vs. object; text/no-text.
- Captions: long vs. short; CTA placement.
- Interpreting retention curves (video)
- Hook drop-off in first 3s? Tighten open and add on-screen text.
- Mid-curve plateau? Keep pace; remove fluff.
- End spike? Add CTA earlier.
Templates and Checklists
Use these to operationalize your post ideal.
- Pre-publish QA
- Does the first line pass the scroll test?
- Is the promise specific and credible?
- One clear CTA? Is it obvious and low-friction?
- Skimmable: subheads, bullets, short paragraphs?
- Visual aids inserted where attention drops?
- Links: internal, external, and UTM-tagged?
- Proof added: data, examples, screenshots?
- Accessibility: alt text, captions, contrast?
- Mobile preview checked?
- Final read out loud for clarity?
- Headline and hook swipe file
- The quickest way to [desired outcome] without [common objection]
- We tested [X] vs. [Y]. Here’s what actually moved [metric]
- The [number]-step playbook to [specific result] in [time frame]
- Stop doing [bad habit]. Try this [simple alternative] instead
- What nobody tells you about [topic]: the hidden constraint
- From [undesired state] to [desired state]: the exact path we used
- If you’re still [symptom], you’re missing this one step
- The lazy person’s guide to [result] (that actually works)
- The post ideal checklist we use to ship in 60 minutes
- I was wrong about [belief]. Here’s the data
- On-page SEO checklist
- Primary keyword in H2-equivalent title and first 100 words.
- Semantic subheads matching search refinements.
- Internal links to pillar pages and relevant posts.
- Descriptive alt text; compressed images; lazy load.
- Meta title 50–60 chars; meta description 140–160 chars with CTA.
- Article schema; updated date; author bio with credentials.
- CTA patterns
- Soft save/share: “Save this for your next launch.”
- Conversation: “Comment ‘checklist’ and I’ll DM the template.”
- Lead magnet: “Grab the full post ideal toolkit (free).”
- Product: “Start a 14-day trial—no credit card.”
- Community: “Join 3,000+ marketers who get the weekly teardown.”
- Common pitfalls to avoid
- Vague promises; buried ledes.
- Multiple CTAs competing for attention.
- Over-reliance on generic best practices without testing.
- Posts that look native but link out too soon (hurting distribution).
- Ignoring accessibility (reduces reach and UX).
- Publishing without UTM or a measurement plan.
Bringing It Together
The post ideal is a repeatable process: set a single goal, build with proven structure, match platform norms, and iterate with data. Start with the benchmarks here, then tune length, hooks, visuals, and timing to your audience. The compounding effect of small, weekly improvements will beat any one-off viral moment—and will move the only metrics that matter to your business.
Summary
- The “post ideal” is a channel- and goal-specific system, not a one-size-fits-all template; prioritize a single objective and design everything around it.
- Use clear structure, platform-aware benchmarks, and tight measurement (UTMs, retention curves, A/B tests) to guide rapid iteration.
- Lean on intent satisfaction, scannability, strong visuals, and one clear CTA to drive consistent reach, engagement, and conversion outcomes.