Show Me the Data Twitter Strategy for Audience Growth
Learn how to grow your Twitter audience using a data-driven strategy with credible sources, compelling visuals, and targeted content formats.
Show Me the Data Twitter Strategy for Audience Growth
In today’s fast-paced social media landscape, “show me the data Twitter strategy” has emerged as a proven way to grow an audience by bringing credible, visually appealing insights directly to users’ feeds. On Twitter, proof matters — when you share numbers, charts, and reputable sources, you improve trust, shareability, and engagement. This guide explains how to implement the “show me the data” approach effectively, from finding your niche and sourcing reliable information to crafting captivating visuals and tracking audience growth.

---
Why the “Show Me the Data” Trend Works
Twitter thrives on concise, impactful messages that stand out in a crowded feed. The “show me the data” trend resonates because it:
- Builds credibility: Facts and figures outshine vague claims.
- Encourages sharing: Data visuals are retweet-friendly.
- Drives engagement: Surprising stats start conversations.
- Creates professional connections: Analysts and journalists seek accurate references.
By anchoring your tweets in verified statistics and compelling designs, you position yourself as a reliable authority in your niche.
---
Identifying Your Niche and Target Audience
Understanding who you are speaking to is key to relevance. Define your niche before creating content:
- Industry focus: Tech, marketing, healthcare, crypto, etc.
- Knowledge level: Data veterans vs. newcomers.
- Pain points: Information gaps you can fill with data.
- Preferred format: Charts, infographics, bite-sized facts.
A clear audience profile guides your tweet topics and visual style.
---
Finding Reliable Data Sources
Trust begins with accuracy. Look for reputable sources such as:
- Academic studies in peer-reviewed journals
- Industry reports from analysts or market researchers
- Government datasets (e.g., census, economic stats)
- Open data platforms like data.gov or Kaggle
- Original analytics from surveys or user testing
Always cite your source, even in short tweet threads, so your audience can cross-check.
---
Verifying and Fact-Checking Data
Cross-check data across multiple sources to detect:
- Bias in collection
- Outdated figures
- Misleading measurement units
- Altered scales in visuals
Credibility checklist:
- Recognized source
- Transparent methods
- Peer-reviewed or cited results
Accuracy safeguards your authority and strengthens trust.
---
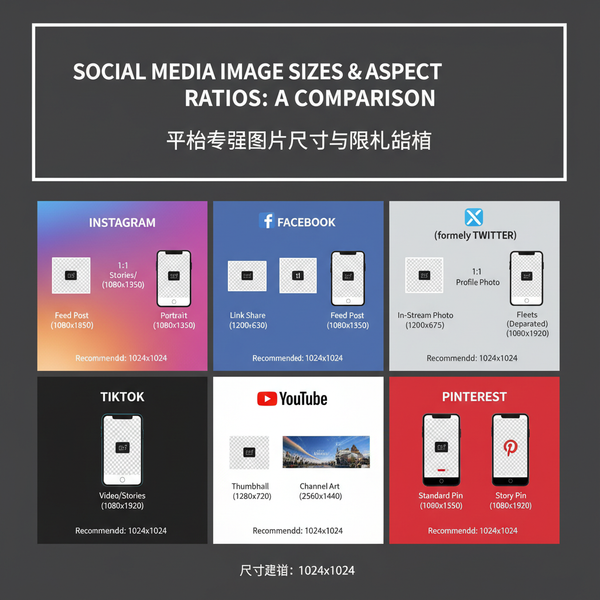
Crafting Compelling Tweet Formats
Data is powerful when visualized. Twitter favors eye-catching, well-designed graphics.
Popular formats:
- Charts: Line (trends), bar (comparisons), pie (distribution)
- Simple tables: Quick-reference stats
- Infographics: Data points plus context

Tools like Canva, Datawrapper, or Flourish help create professional visuals.
Example HTML table for chart-ready data:
| Platform | Monthly Active Users (M) | Growth YoY (%) |
|---|---|---|
| 436 | 4.8 | |
| 310 | 7.2 | |
| 2000 | 5.6 |
Convert such tables into graphics and post them directly in tweets.
---
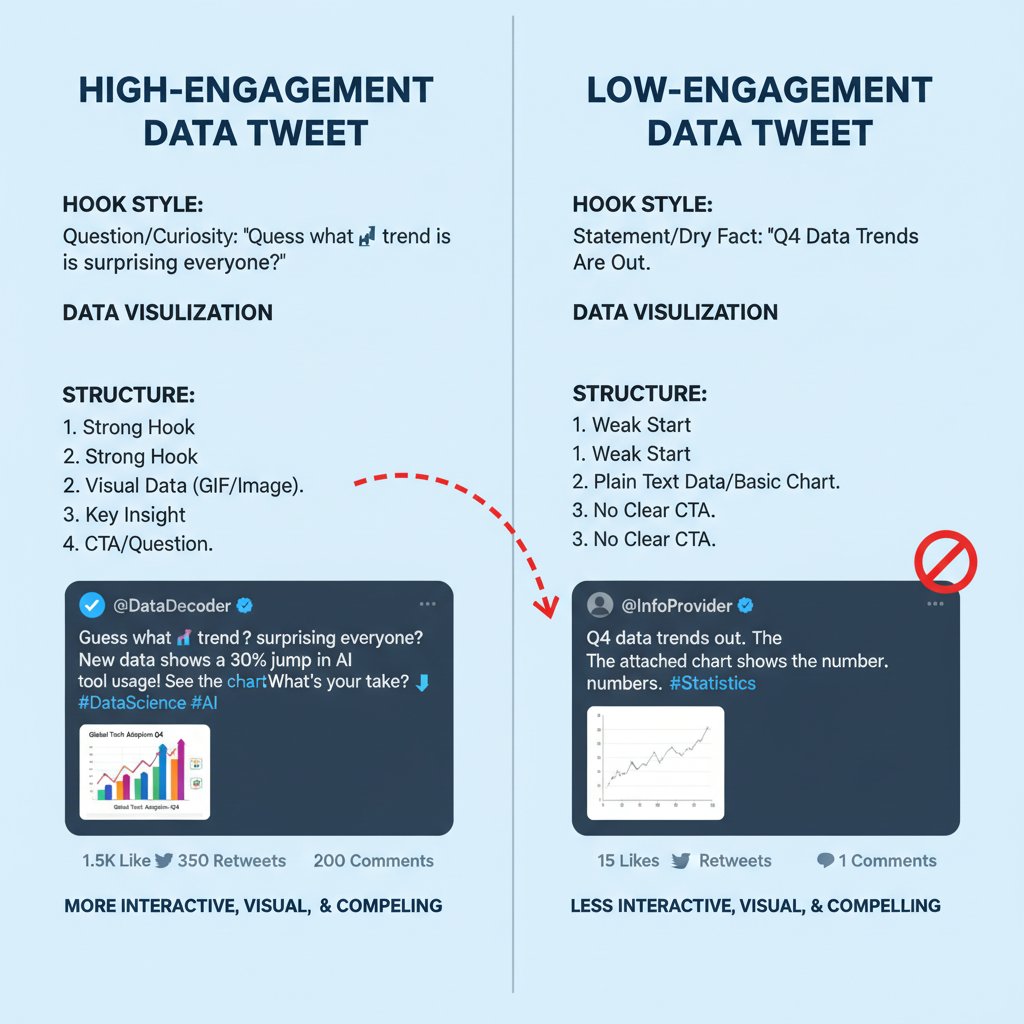
Writing Strong Hooks That Convert
The opening line draws readers in. Use curiosity-driven or provocative hooks:
- “Only 16% of marketers track ROI accurately — here’s why…”
- “We analyzed 2M tweets to find the secret to double engagement.”
- “Remote workers are 22% more productive — agree or disagree?”
Numbers, surprises, and challenges attract clicks and replies.
---
Thread Strategy: Making Big Data Digestible
When dealing with complex datasets, break them into threads to present ideas step-by-step.
Benefits:
- Maintains reader interest
- Allows richer explanations
- Boosts visibility with each reply in the thread
Thread best practices:
- Start with a captivating hook.
- Group related data into 3–7 sections.
- Pepper in visuals.
- End with a recap or call-to-action.
---
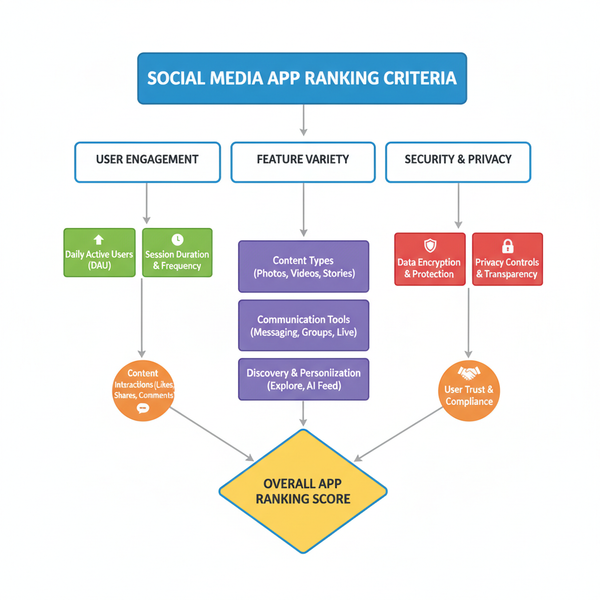
Measuring Engagement with Twitter Analytics
Measure performance regularly to optimize your strategy. Twitter Analytics highlights crucial metrics:
| Metric | What It Measures | Why It Matters |
|---|---|---|
| Impressions | Times a tweet is viewed | Shows reach |
| Engagement Rate | Interactions per impression | Indicates resonance |
| Link Clicks | URL clicks in tweets | Measures conversions |
| Profile Visits | Clicks to your profile | Reflects follower interest |
Review weekly to identify winning formats and topics.
---
Amplifying Reach with Hashtags and Communities
Use relevant hashtags for discoverability:
- #DataViz
- #Analytics
- #ShowMeTheData
- #OpenData
- #DatavizFriday
Participate in Twitter chats or niche communities to boost authority and organic growth.
---
Collaborating with Influencers or Analysts
Teamwork expands reach. Collaboration ideas:
- Co-create data visuals
- Run challenge threads together
- Quote and tag experts
- Exchange retweets and mentions
Influencer partnerships deliver exposure to new, targeted audiences.
---
Repurposing High-Performing Tweets
Use your best Twitter content across other channels:
- Expand into blog posts
- Adapt for LinkedIn’s professional tone
- Send as newsletter highlights

Repurposing maximizes the lifespan of your content and enhances brand awareness.
---
Tracking Audience Growth and Adjusting Strategy
Monitor progress to refine tactics:
- Record baseline metrics.
- Track weekly/monthly.
- Link spikes to specific posts.
- Shift frequency, visuals, or topics as needed.
A feedback loop ensures consistent improvement in engagement and reach.
---
Final Thoughts
The show me the data Twitter strategy blends credibility with storytelling to grow a robust audience. By combining verified information, strong visuals, engaging hooks, and thoughtful analysis with ongoing measurement, you can position yourself as the go-to data source in your niche.
Start applying these methods now — track your numbers, refine your style, and watch your following expand as more users discover the value of data-driven insights.