Social Media Analytics Template for Marketing Reports
Learn how to create a social media analytics template that tracks key KPIs, structures data, and improves marketing report clarity and efficiency.
Introduction to Social Media Analytics Templates for Better Reporting
In today's competitive digital environment, social media analytics templates have become essential tools for marketers, brands, and agencies. Every post, ad, and interaction generates an enormous amount of data — likes, comments, shares, impressions, clicks, and conversions — making it difficult to track performance without a defined structure. A well‑designed template organizes this data, improves accuracy, and helps communicate results clearly to decision‑makers.
By standardizing both what you measure and how you present it, analytics templates save time, ensure report consistency, and make it faster to spot patterns or issues. Ultimately, they empower data‑driven marketing strategies that drive ROI.

---
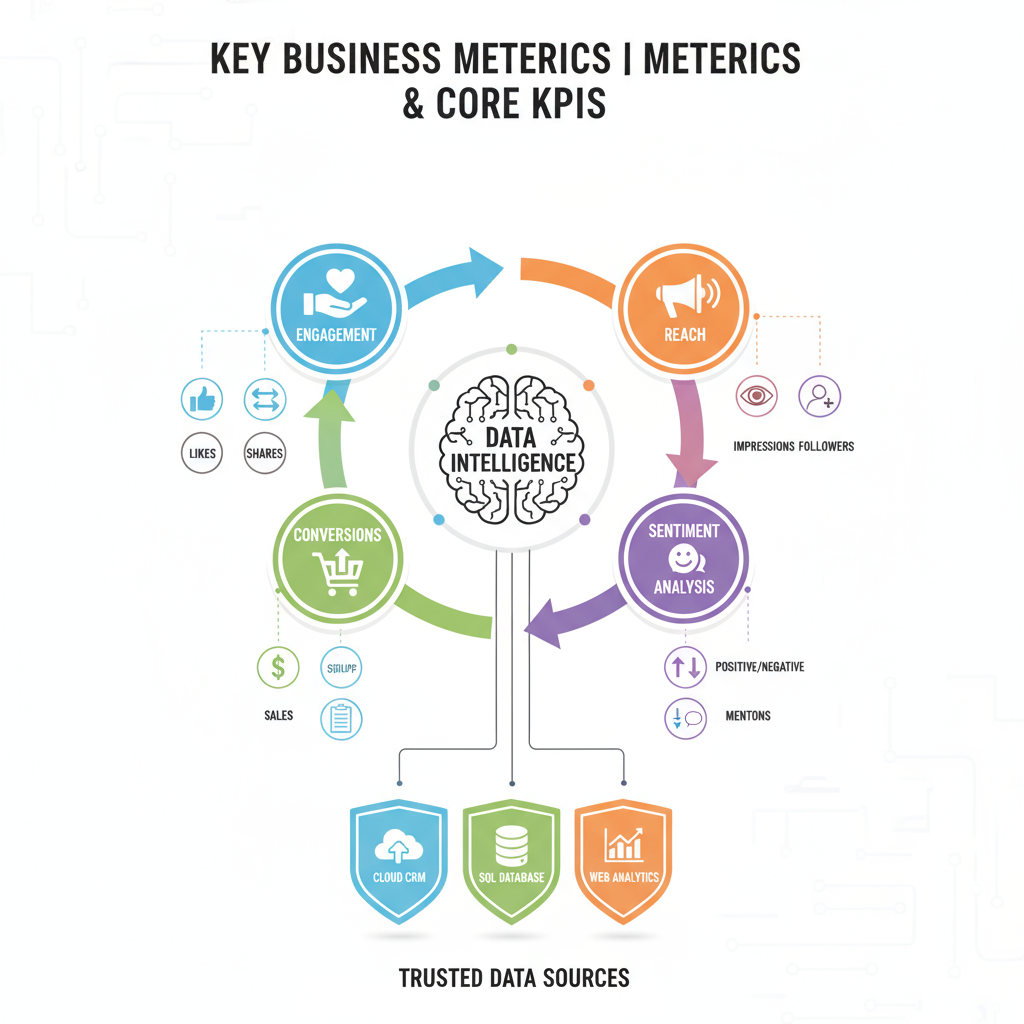
Key Metrics to Track in a Social Media Analytics Template
When designing or using a template, start with metrics that map directly to your marketing goals. Tracking the right numbers lets you measure effectiveness and adjust campaigns quickly.
Core Social Media KPIs
- Engagement Rate – Ratio of total engagements (likes, comments, shares) to total followers or impressions.
- Reach – Number of unique users who saw your content.
- Impressions – Total number of times your content was displayed, including repeat views.
- Click‑Through Rate (CTR) – Percentage of users who clicked links in your post or ad.
- Conversions – Actions taken such as purchases, sign‑ups, or downloads.
These are the foundation of most reports, giving you both awareness and action insights.
---
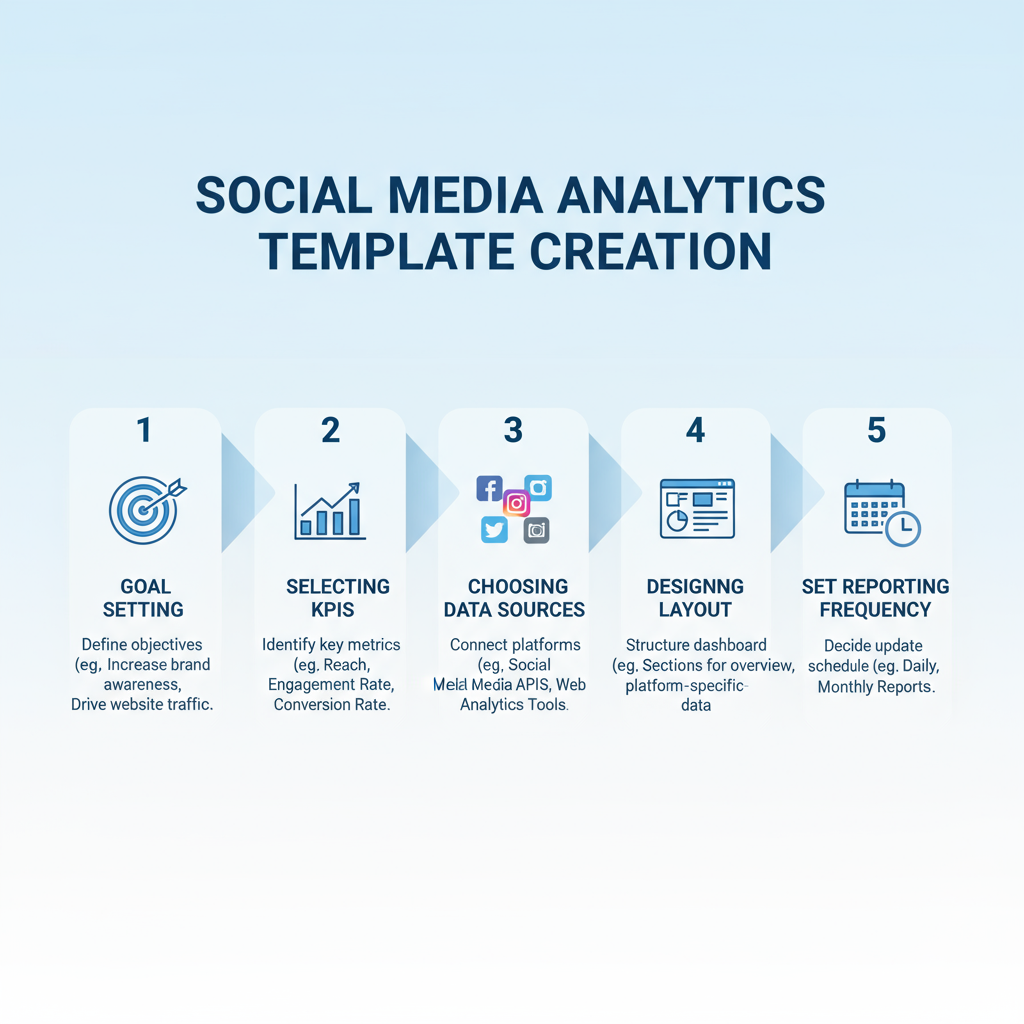
Setting SMART Goals Before Tracking Metrics
You can’t measure success without clearly defined objectives. Before populating your template:
- Establish business goals – Brand awareness, lead generation, sales, retention.
- Choose specific KPIs – Only those directly supporting your objectives.
- Set measurable targets – Benchmark values that define success.
Document these in your template so numbers have context and purpose.
---
Designing a Reusable, Scalable Template
An effective social media analytics template should be flexible and easy to update. Use Excel or Google Sheets based on team preferences.
Key Components
- Metric Tables – Organized by platform and reporting period.
- Charts/Graphs – Visualize trends and highlight peaks or dips.
- Calculated Fields – Automate KPIs like engagement rate and CTR.
- Conditional Formatting – Color coding for performance changes.
---
Trusted Data Sources for Accuracy
For a complete and accurate report, gather data from:
- Native Insights – e.g., Facebook Insights, Instagram Insights, LinkedIn Analytics, TikTok Analytics, Twitter/X Analytics.
- Google Analytics – Connects social activity with website traffic and conversions.
- Third‑Party Tools – Sprout Social, Hootsuite, Buffer, SEMrush for multi‑channel reporting.
Merging these sources into one sheet provides a 360‑degree performance view.
---
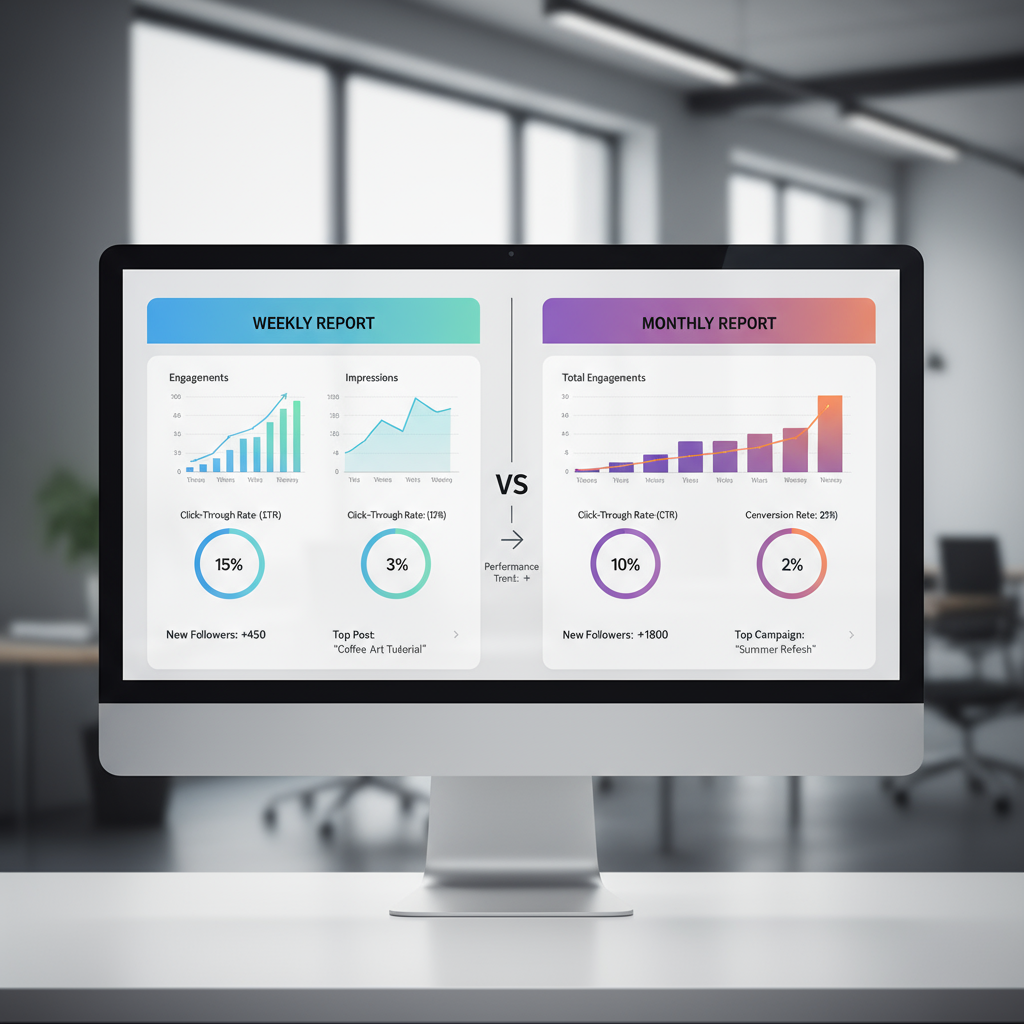
Weekly vs. Monthly Reporting: Choosing Your Frequency
The right reporting frequency depends on campaigns and stakeholders.
Weekly Reports
- Great for active campaign oversight.
- Quickly identify emerging issues.
- Focus on short‑term metrics such as engagement and CTR.
Monthly Reports
- Better for strategic analysis and budgeting.
- Show macro trends in reach, impressions, and conversions.
- Compare month‑over‑month progress.
---
Structuring Data for Maximum Clarity
Structure is as important as the data:
- Raw Data Tab – Store unprocessed metrics.
- Summary Dashboard – Show key performance highlights.
- Trend Charts – Visualize performance shifts.
Conditional formatting can emphasize significant increases or decreases in performance.
---
Example Weekly Workflow to Keep Reports Up‑to‑Date
- Export metrics from each platform every Monday.
- Paste into the Raw Data tab.
- Let formulas populate KPI cells automatically.
- Review Summary Dashboard for spikes or drops.
- Add notes to explain significant changes.
---
Interpreting the Numbers to Create Actionable Insights
Collecting data is only the start:
- Spot performance spikes – Link to campaigns or popular posts.
- Investigate declines – Could be due to algorithm changes or reduced activity.
- Compare channels – Redirect investment to high‑performing platforms.
---
Platform‑Specific Customization
Because each platform has distinctive metrics, tailor your template accordingly:
| Platform | Special Metrics |
|---|---|
| Page Likes, Post Shares, Video Views | |
| Story Reach, Saves, Profile Visits | |
| Twitter/X | Mentions, Retweets, Hashtag Performance |
| Profile Views, Connection Requests, InMail Response | |
| TikTok | Video Completion Rate, Trending Sounds Used |
Adjusting fields per platform ensures you capture the most meaningful data.
---
Presenting Your Analytics for Stakeholder Impact
To make reports more persuasive:
- Include screenshots of high‑impact posts.
- Use consistent brand‑aligned visuals.
- Summarize top takeaways at the start of the report.
This approach makes it easy for executives or clients to digest and act on the data.
---
Automating the Reporting Process
Automation saves time and reduces human error:
- Platform APIs – Pull data directly into spreadsheets.
- Automation Tools – Zapier or Make to route analytics data.
- Live Dashboards – Google Data Studio (Looker Studio) for real‑time metrics.
---
Mistakes to Avoid in Reporting
Stay credible by avoiding:
- Excessive metric tracking – Focus only on KPIs that support your goals.
- Missing context – Relate performance changes to campaigns or events.
- Ignoring qualitative data – Sentiment and comments add depth to numbers.
---
Conclusion and Free Template Offer
A structured social media analytics template helps you measure results consistently, draw meaningful conclusions, and optimize campaigns faster. Whether built in Excel or Google Sheets, your template should evolve with your needs — adjusting for platforms, updating KPIs, and refining visuals based on feedback.
Pro Tip: Reassess your template quarterly to ensure metrics, calculations, and presentation styles remain relevant to changing strategies and social media trends.
Get Started Now – Download our free, customizable social media analytics template to take control of your reporting process and make smarter, data‑backed marketing decisions.