Social Media Education Benchmarks for Measuring Digital Lear
Learn how to set and track social media education benchmarks to measure engagement, reach, and learning outcomes for effective digital campaigns.
Introduction to Social Media Education Benchmarks
In today’s digital-first learning environment, social media education benchmarks play a pivotal role in measuring and improving the performance of educational initiatives across platforms like Facebook, LinkedIn, Instagram, and YouTube. These benchmarks act as standardized reference points, enabling schools, universities, and online learning providers to assess engagement, reach, and learner impact while aligning campaigns with institutional goals. By analyzing both qualitative and quantitative data, educators can make informed decisions, adapt to evolving trends, and enhance student connections.

---
Understanding Social Media Education Benchmarks
Social media education benchmarks are measurable standards that help organizations assess the effectiveness of their educational campaigns on social platforms. They serve as reference points against which performance can be evaluated over time.
Educational institutions—schools, universities, online learning platforms—use them to track how well their social media initiatives connect with students, parents, and the broader educational community.
By establishing clear benchmarks, you can:
- Identify strengths and weaknesses in your digital learning outreach.
- Compare performance with industry trends.
- Adapt strategies to meet evolving learner needs.
---
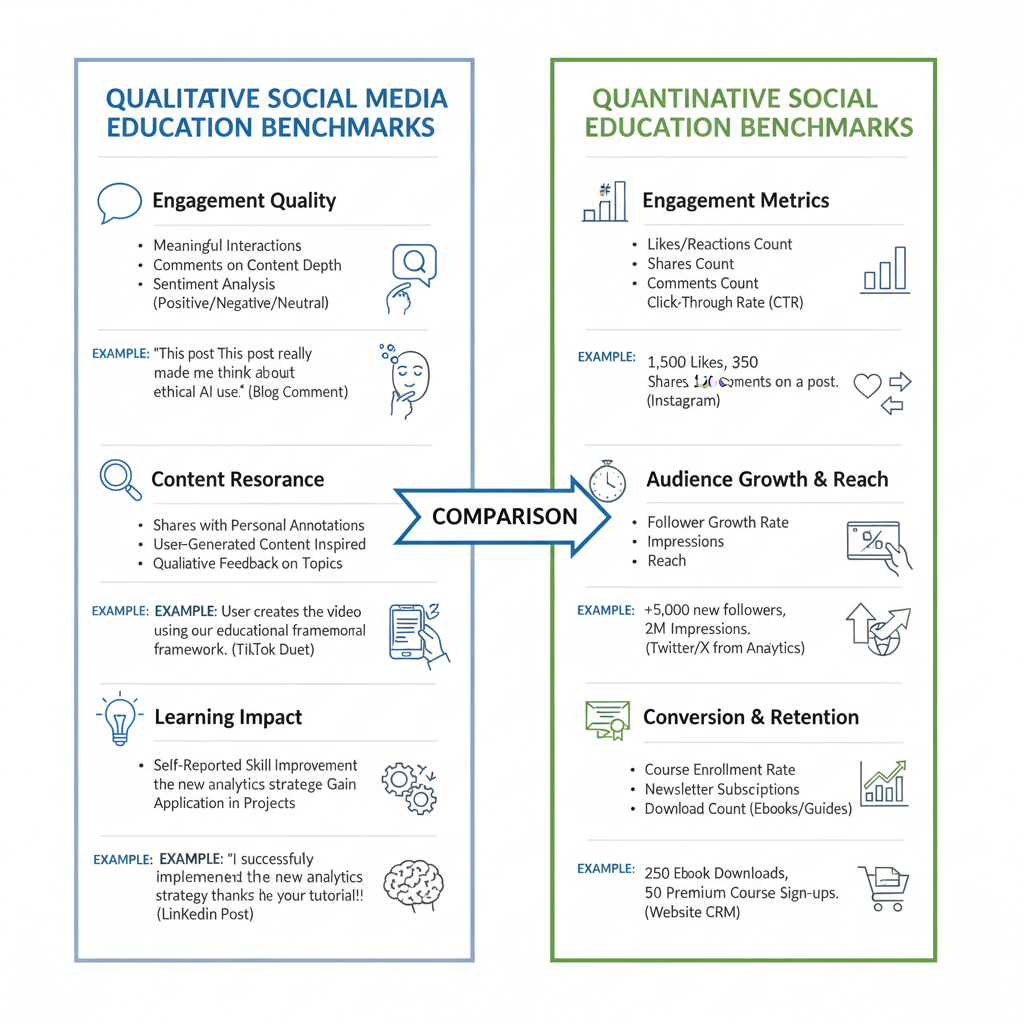
Qualitative vs. Quantitative Benchmarks
There are two main categories of benchmarks for social media in education.
Qualitative Benchmarks
These focus on the quality of social media interactions and content:
- Narrative feedback from learners or parents.
- Tone and engagement style of posts.
- Perceived relevance of shared educational resources.
- Visual appeal and storytelling.
Qualitative benchmarks are often gathered through surveys, focus groups, and direct comments on posts.
Quantitative Benchmarks
These are numerical measures derived from analytics:
- Follower growth (month-over-month).
- Post reach and impressions.
- Engagement rate (likes, comments, shares).
- Click-through rate to educational materials.
- Completion rates for linked courses or webinars.
Quantitative benchmarks provide hard data to analyze trends statistically.
---
Common Benchmarking Categories
To set relevant social media education benchmarks, organizations often examine several core categories:
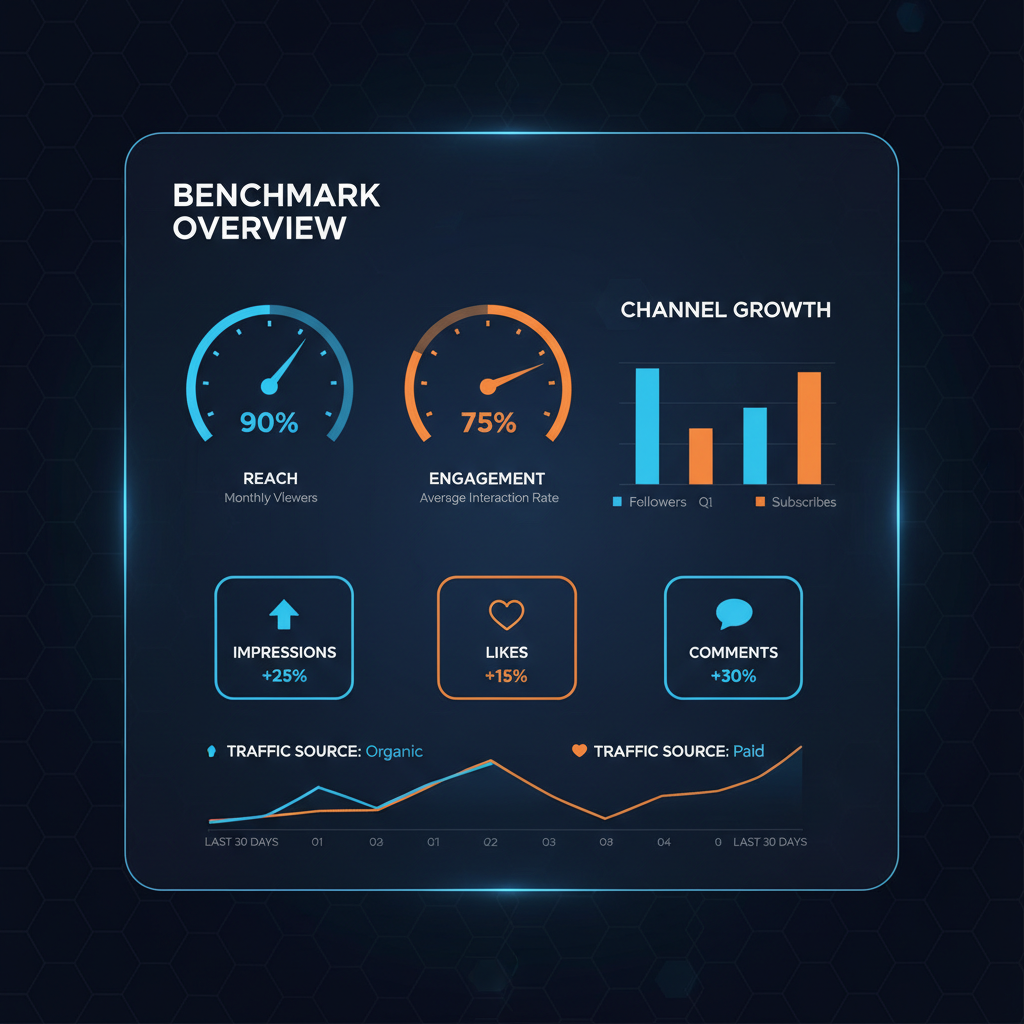
1. Reach
Measures how many people have seen your content. It reflects potential awareness.
2. Engagement
Tracks user actions such as likes, shares, or comments. Indicates audience involvement.
3. Content Quality
Evaluates whether your content is accurate, engaging, and educationally valuable.
4. Learner Outcomes
Focuses on the tangible educational impact—e.g., improved scores, course completions.
| Category | Examples | Why It Matters |
|---|---|---|
| Reach | Post impressions, followers gained | Shows awareness growth |
| Engagement | Comments, shares, reactions | Indicates audience interaction |
| Content Quality | Accuracy, visual appeal | Maintains trust and credibility |
| Learner Outcomes | Course completion rates | Measures impact on learning |
---
Setting SMART Goals for Social Media Education Campaigns
SMART goals help you align benchmarks with actionable objectives.
SMART stands for:
- Specific – Define one precise metric to improve (e.g., increase retweets).
- Measurable – Choose benchmarks that can be quantified.
- Achievable – Set realistic targets based on resources.
- Relevant – Ensure the goal aligns with educational mission.
- Time-bound – Give yourself deadlines to evaluate success.
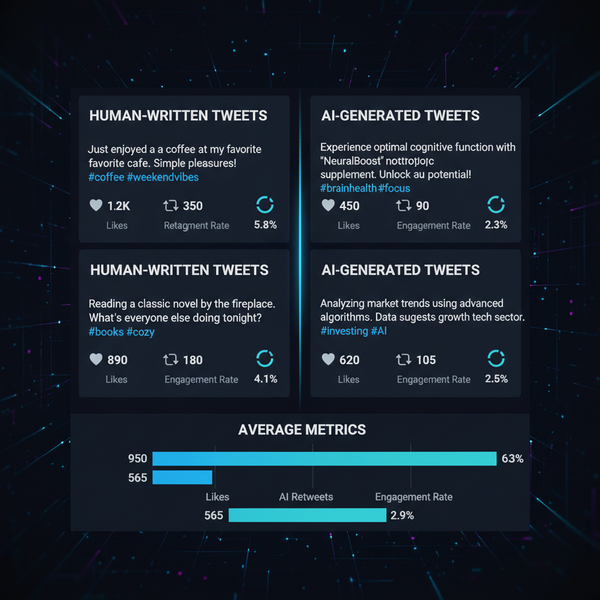
Example: Increase Instagram engagement rate from 3% to 5% within six months to better connect with high school students.
---
Industry Averages vs. Organizational Benchmarks
Comparing your institution’s metrics with industry averages reveals competitive positioning.
For example:
- University pages might average 4–6% engagement rates on Instagram.
- Educational YouTube channels often aim for watch times exceeding 5 minutes per video.
However, industry averages may not match your environment. Organizational benchmarks—based on historical data—are often more meaningful for tracking specific progress.
Tip: Use both comparisons to get the full picture:
- Industry averages for external positioning.
- Internal benchmarks for progress tracking.
---
Tools and Analytics Platforms
Accurate measurement depends on robust tracking tools. Some widely used platforms include:
- Facebook Insights – For reach, engagement, and demographic analysis.
- LinkedIn Analytics – Professional audience tracking, post performance.
- Google Analytics – Tracks website traffic from social media campaigns.
- Twitter Analytics – Measures tweet impressions and engagement rates.
- Hootsuite / Buffer – Cross-platform scheduling and aggregated metrics.
By combining native and third-party analytics, you can triangulate results for accuracy.
---
Case Studies: Education Institutions Improving Engagement
Example 1: University Social Media Campaign
A mid-sized university set a benchmark of reaching 20,000 Instagram followers within a year. They refined their posting schedule—focusing on student achievement stories and behind-the-scenes campus life. They exceeded their benchmark, achieving higher enrollment inquiry traffic via Instagram.
Example 2: High School District
A district used Facebook Insights to benchmark parent engagement on monthly events posts. Identifying event-related content as the highest performer, they redesigned their editorial calendar to prioritize such posts, increasing event attendance by 23%.
---
Best Practices for Collecting and Interpreting Benchmark Data
- Integrate Multiple Data Sources – Avoid relying on one platform’s metrics.
- Define Baselines – Establish current state for accurate comparison.
- Regularly Review Trends – Monthly or quarterly reviews help detect shifts early.
- Contextualize Numbers – Consider seasonality and external events.
- Document Benchmark History – Maintain records to track long-term progress.
---
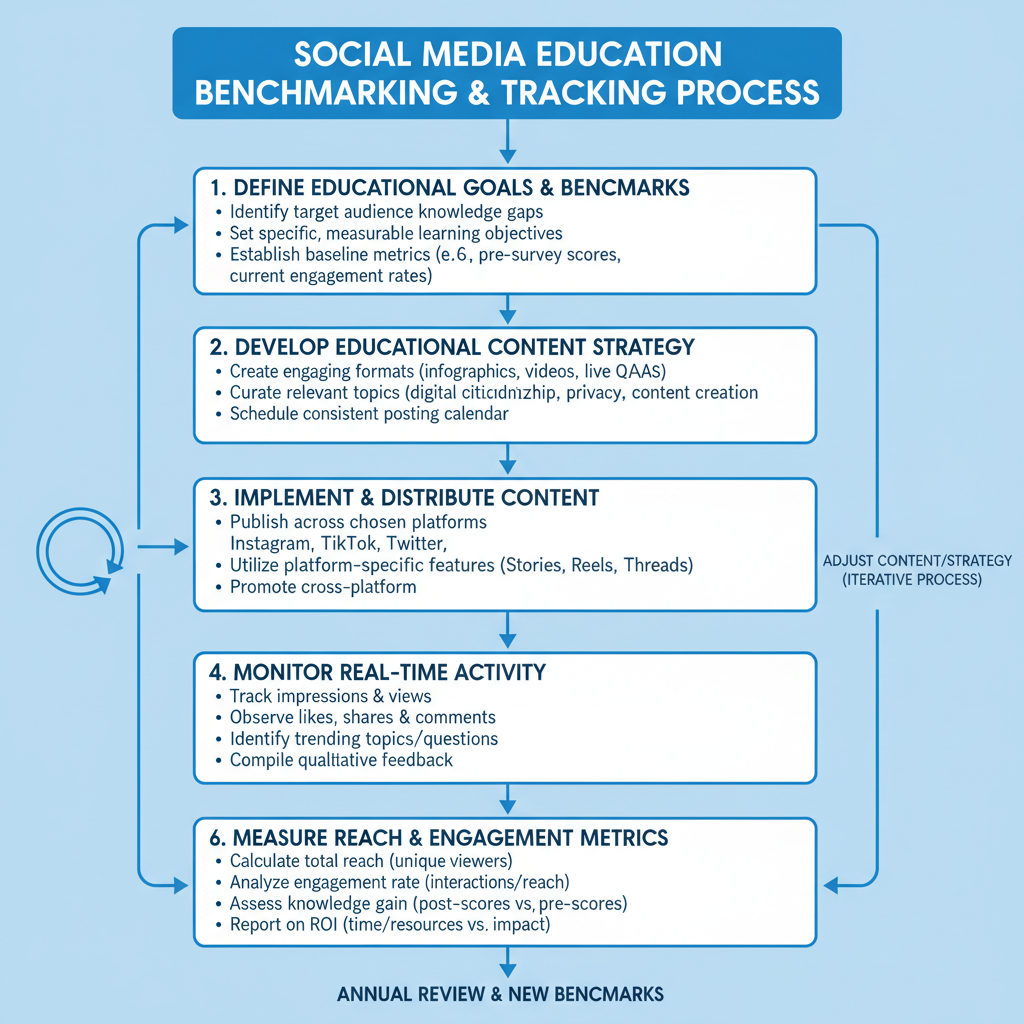
Adjusting Strategies Based on Performance
Benchmark data should guide strategic changes:
- Low engagement? Experiment with content formats such as infographics, videos, polls.
- High reach but low learner outcomes? Implement stronger calls-to-action for educational resources.
- Declining completion rates? Assess whether course content is user-friendly on mobile.
Iteration is essential—use the test-measure-adjust cycle to improve continuously.
---
Challenges in Benchmarking
Benchmarking in social media education faces unique hurdles:
Data Accuracy
Metrics may vary across platforms, and algorithm changes can skew results.
Changing Algorithms
Frequent updates to social algorithms can unpredictably affect organic reach.
Diverse Learner Demographics
Different segments respond differently, complicating comparisons.
Solution: Diversify content types and measure performance per audience segment.
---
Future Trends in Social Media Education Benchmarking
Emerging technologies poised to transform benchmarking include:
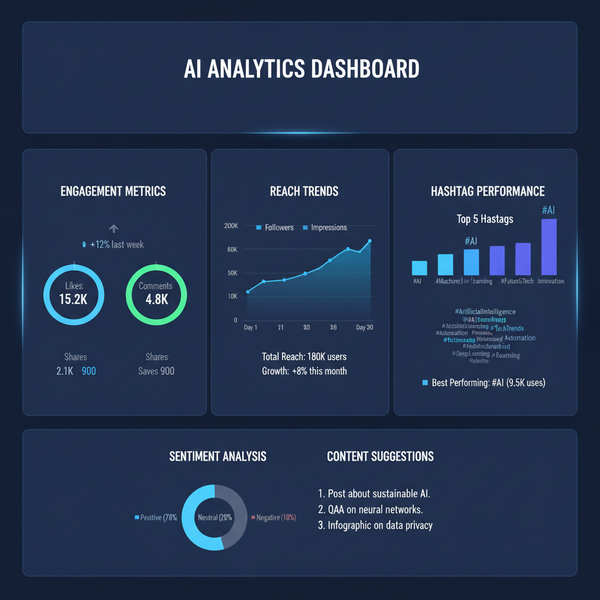
- AI-powered insights predicting engagement trends.
- Automated reporting dashboards integrating multi-platform data.
- Advanced sentiment analysis for qualitative indicators.
- LMS integration to directly connect social activity with academic results.
Expect more personalization and real-time adjustments tailored to specific learner groups.
---
Conclusion: Benchmarking for Continuous Improvement
Integrating social media education benchmarks into your digital strategy ensures your learning outreach remains impactful, relevant, and measurable.
Continuous improvement involves:
- Setting clear benchmarks.
- Measuring consistently with reliable tools.
- Comparing against historical and industry data.
- Implementing data-informed changes.
By making benchmarking a core habit, educational institutions can enhance student engagement, improve their online presence, and show tangible improvements in learning outcomes.
Ready to elevate your social media education strategy? Start setting precise benchmarks today and watch your engagement and learning results grow.