How to Build an Effective Social Media Marketing Dashboard
Learn how to create a high-impact social media marketing dashboard with the right KPIs, tools, and integrations for real-time, cross-platform insights.

Introduction to Social Media Marketing Dashboards
A social media marketing dashboard is an indispensable tool for modern marketers, offering a centralized way to monitor, analyze, and optimize campaigns across multiple platforms. By consolidating critical KPIs—such as engagement rates, CTR, and conversions—into a single view, marketers can quickly identify performance trends, implement data-driven strategies, and align efforts with broader business objectives. This guide explains the key elements, setup processes, and optimization tips for building a high-impact dashboard that drives measurable results.
---
Understanding the Purpose of a Social Media Marketing Dashboard
A social media marketing dashboard serves as a centralized hub for tracking, visualizing, and analyzing the performance of your social media campaigns. It unifies data from various platforms—Facebook, Instagram, LinkedIn, Twitter, TikTok, and more—into a single interface, enabling faster decision-making and better strategic alignment.
Key purposes include:
- Monitoring KPIs and Metrics: Gives you real-time access to performance indicators like engagement rate and click-through rate (CTR).
- Aligning With Audience Goals: Helps tailor content strategies for specific demographics, interests, and behaviors.
- Enhancing Communication: Improves collaboration among marketing teams, executives, and stakeholders through shared insights.
By maintaining a well-structured dashboard, you can systematically evaluate what works, what doesn’t, and where to allocate marketing resources more effectively.
---
Essential Metrics to Track
The success of your dashboard hinges on choosing the right metrics. Including too many may cause clutter; too few, and you miss critical insights.
Core Metrics Include:
- Engagement Rate: Measures likes, comments, shares relative to audience size.
- Reach: Total number of unique viewers who saw your content.
- Impressions: How often your content was displayed, regardless of clicks.
- CTR (Click-Through Rate): The ratio of users who click on your link to those who viewed it.
- Conversions: Actions taken that align with your goals—sign-ups, purchases, downloads.
Pro Tip: Segment metrics by platform to identify differences in audience engagement behavior.
---
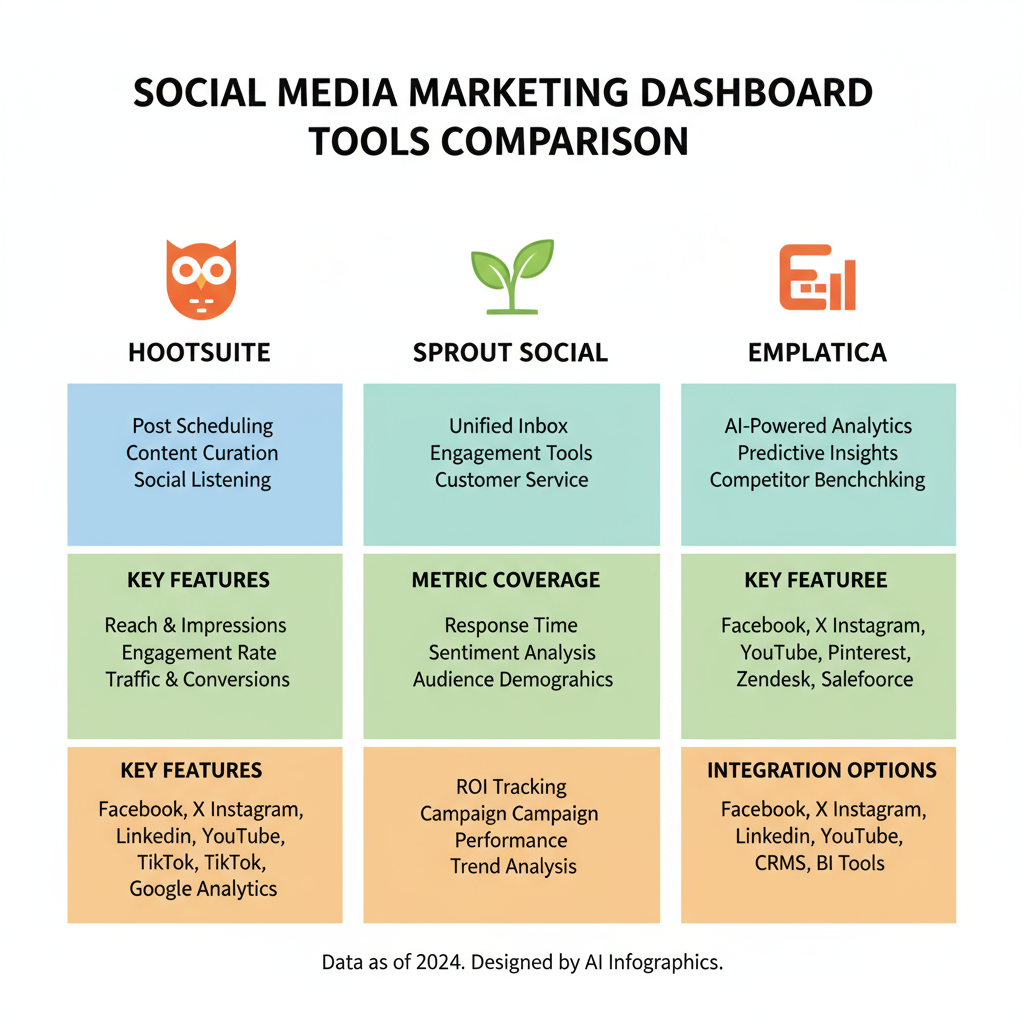
Comparing Popular Dashboard Tools
Not all dashboard solutions are equal. Below is a quick comparison of popular tools for building an effective social media marketing dashboard.
| Tool | Strengths | Limitations |
|---|---|---|
| Native Analytics (FB Insights, Twitter Analytics, etc.) | Free, platform-specific, quick setup | Limited cross-platform integration |
| Google Data Studio | Customizable, integrates with multiple sources, free | Requires technical setup for connectors |
| Hootsuite | All-in-one scheduling + reporting, team collaboration features | Subscription cost, may have data freshness limits |
| Sprout Social | Advanced analytics, sentiment analysis, robust integration | Premium pricing tier, learning curve |
When selecting a tool, consider budget, desired features, ease of use, and team size.
---
Setting Up Account Integrations for Real-Time Data Syncing
To ensure your dashboard reflects timely and accurate data:
- Connect API Integrations: Use native connectors or authorized third-party services to pull data automatically.
- Enable OAuth Authentication: Maintain security standards by using proper authentication methods.
- Schedule Data Refreshes: Many tools allow near real-time updates or scheduled intervals.
- Verify Data Accuracy: Always cross-check initial reports against native analytics for discrepancies.
Example API Setup:
If you're using Google Data Studio, connect via community connectors such as Supermetrics or use Google’s native connectors for platforms like Google Analytics or YouTube.
Step 1: Open Data Studio
Step 2: Click "Create Data Source"
Step 3: Select Connector (e.g., Facebook Insights)
Step 4: Authorize Access
Step 5: Add to Report
---
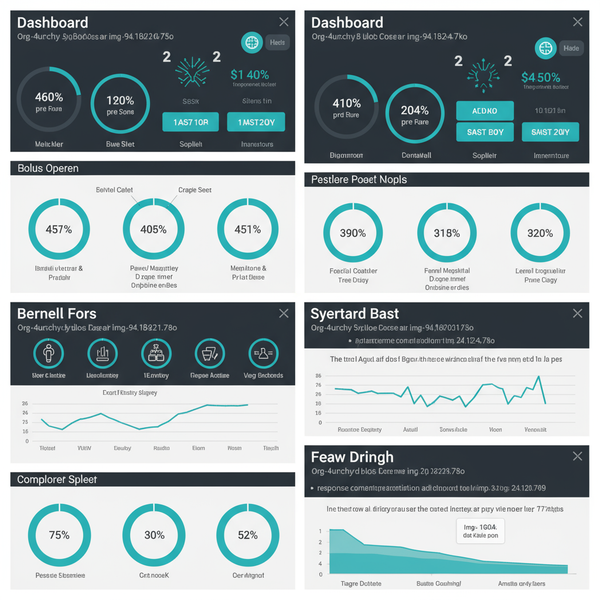
Designing a Clear and Actionable Layout
A visually appealing dashboard layout improves comprehension and reduces reporting fatigue.
Best Practices:
- Visual Hierarchy: Place most critical KPIs at the top.
- Use Charts: Bar charts, line graphs, and pie charts can quickly highlight trends.
- Color Codes: Apply green for growth, red for decline, and orange for stable performance.
- Tables: Provide granular data for deeper analysis without overwhelming the main visuals.
- Annotations: Add notes explaining performance spikes or dips.
Consider multi-tab dashboards to separate campaign performance from audience insights.
---
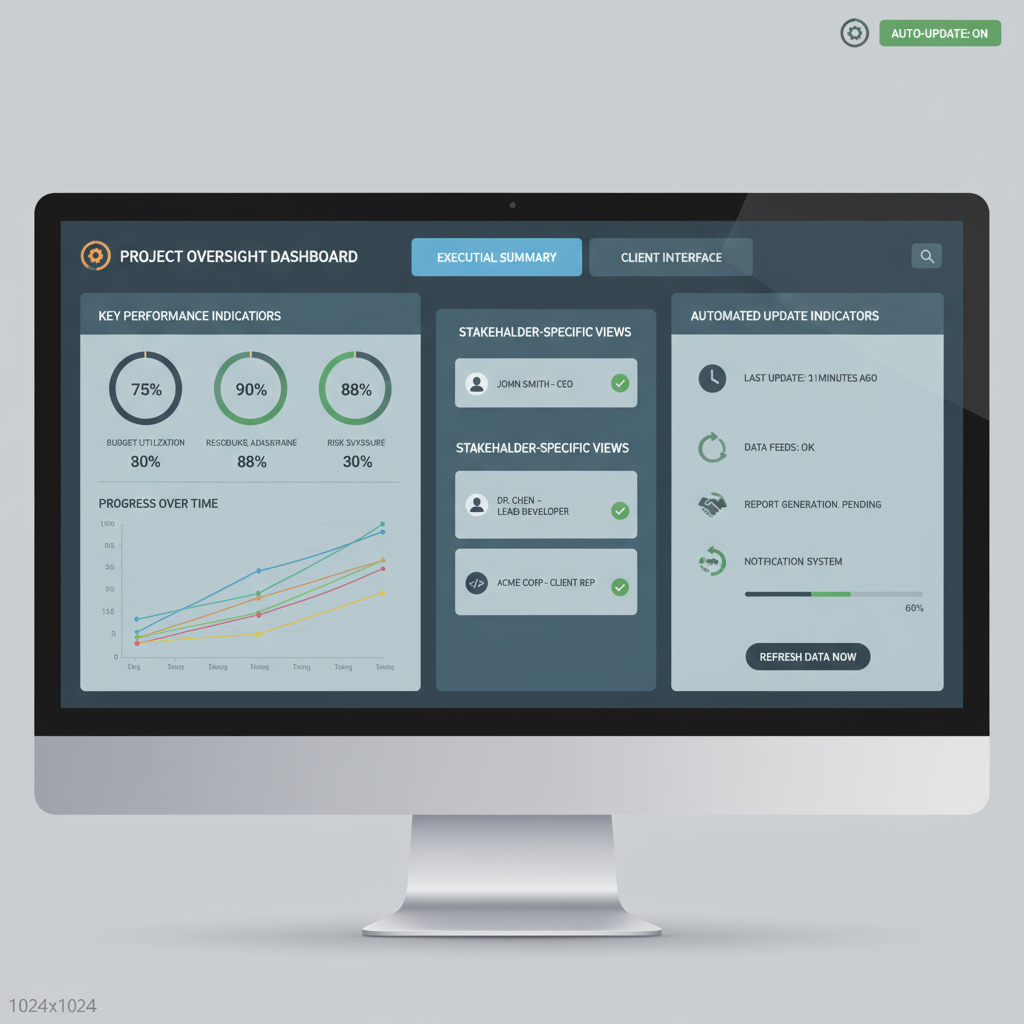
Customizing Dashboards for Different Stakeholders
Different stakeholders require varying levels of detail:
- Executives: Prefer high-level metrics like ROI, campaign reach, and growth trends.
- Marketing Team: Needs detailed breakdowns of content performance, demographic data, and platform-specific engagement.
- Sales Teams: Value conversion-related data to align with sales funnels.
By customizing views, you ensure stakeholders receive relevant insights instead of being overwhelmed with unnecessary information.
---
Establishing Reporting Frequency and Automated Updates
The optimal reporting frequency depends on your campaign type and goals:
- Daily: For fast-moving campaigns or ad spend monitoring.
- Weekly: Ideal for organic performance tracking.
- Monthly/Quarterly: To evaluate long-term trends and strategic shifts.
Automation tips:
- Enable email delivery of dashboards to key stakeholders.
- Use push notifications for significant performance changes.
- Schedule auto-refreshes in your dashboard tool to minimize manual intervention.
---
Analyzing and Interpreting Data for Campaign Optimization
Collecting data is only half the battle; interpretation drives improvement.
Steps for actionable analysis:
- Identify Trends: Look for consistent upward or downward shifts in engagement or conversion.
- Segment Data: Separate by platform, post format, or audience demographic.
- Test Hypotheses: Use A/B testing to validate assumptions (e.g., does posting at 6 PM improve engagement?).
- Iterate: Apply findings to future campaigns promptly.
Example:
If CTR drops despite high impressions, this could indicate that your creative is not resonating with viewers—requiring a content revamp.
---
Incorporating Competitor Benchmarking
Competitor benchmarking adds context to your performance data, helping you understand market positioning.
How to integrate it into the dashboard:
- Track competitors’ follower growth and engagement rates.
- Use social listening tools to capture sentiment and mentions.
- Compare posting frequency and content types.
Why it matters:
Benchmarking guides realistic goal setting and inspires improvement strategies.
---
Tracking ROI and Aligning Insights with the Overall Marketing Strategy
Ultimately, a social media marketing dashboard should tie back to business objectives.
Ways to calculate ROI:
- Direct Revenue: Measure sales directly attributed to social campaigns.
- Lead Value: Assign financial value to leads generated via social channels.
- Cost Savings: Calculate efficiency gains from content repurposing or automation.
Strategic Alignment Steps:
- Map campaign KPIs to organizational goals.
- Review dashboard insights during strategy meetings.
- Adjust budgets and creative direction based on ROI performance.
By aligning dashboard insights with broader marketing and business goals, your social efforts gain clear purpose and measurable impact.
---
Final Thoughts and Next Steps
An effective social media marketing dashboard streamlines reporting, improves transparency, and accelerates decision-making. By selecting the right tools, integrating accounts for real-time updates, designing clear layouts, and customizing views for different stakeholders, you can transform raw data into actionable insights that deliver tangible results.
With competitor benchmarking, ROI tracking, and consistent analysis, your dashboard becomes the strategic nerve center of your social media operations.
Ready to elevate your marketing? Start by mapping your key metrics and selecting a dashboard tool that fits your business needs—so you can turn data into decisive action today.