Social Media Report Example for Creating Actionable Insights
Learn how to create a social media report that transforms performance data into actionable insights, tracks KPIs, and proves marketing ROI.

Social Media Report Example: Turning Data into Actionable Insights
A social media report example serves as more than a compilation of metrics — it’s a strategic document that transforms raw performance data into clear, actionable guidance. When structured effectively, it reveals trends, measures ROI, and directs the next moves in your marketing strategy. In this guide, you'll learn how to create a report that stakeholders will value and use.
---
Purpose of a Social Media Report
An effective social media report achieves several objectives:
- Tracking progress: Monitor growth, engagement, and the overall health of your social channels.
- Providing insights: Identify what’s working — and what’s not.
- Supporting decision-making: Guide future campaign strategies, budgets, and pivots.
- Demonstrating ROI: Prove the tangible returns from your social activity to stakeholders.
When aligned with business objectives, your report ensures each post, ad, and campaign contributes toward measurable results.
---
Identifying Key Stakeholders and Their Data Needs
Understanding who will read the report is essential to customizing content and depth:
- Marketing Managers – Seek campaign ROI, engagement patterns, and leads generated.
- Content Creators – Focus on post performance, reach, and audience sentiment.
- Executives – Want a high-level view tied to revenue impact and growth KPIs.
- Advertising Specialists – Need precise conversion, CPC, and CTR details.
Tailoring your report to each audience ensures it offers maximum relevance and impact.
---
Selecting Relevant KPIs for Different Platforms
Choose Key Performance Indicators (KPIs) that match your goals and each platform's strengths.
Examples by platform:
| Platform | Key KPIs |
|---|---|
| Engagement rate, Reach, CTR, Conversions | |
| Follower growth, Post saves, Story views, Engagement rate | |
| Twitter (X) | Mentions, Retweets, Engagement rate, Link clicks |
| Click-through rate, Impressions, Followers gained, Lead form fills | |
| Pin saves, Outbound clicks, Impressions |
By adapting KPIs to the platform, you avoid irrelevant data overload and maintain focus.
---
Gathering Data from Analytics Tools
An accurate social media report example combines information from multiple analytics sources:
- Native platform analytics – e.g., Facebook Insights, Instagram Analytics, LinkedIn Analytics.
- Google Analytics – Reveal website behaviors from social referrals.
- Third-party analytics tools – Platforms like Hootsuite, Sprout Social, and Buffer simplify cross-platform reporting.
Ensure proper tracking setup (UTM parameters, pixel integrations) to support reliable reporting.
---
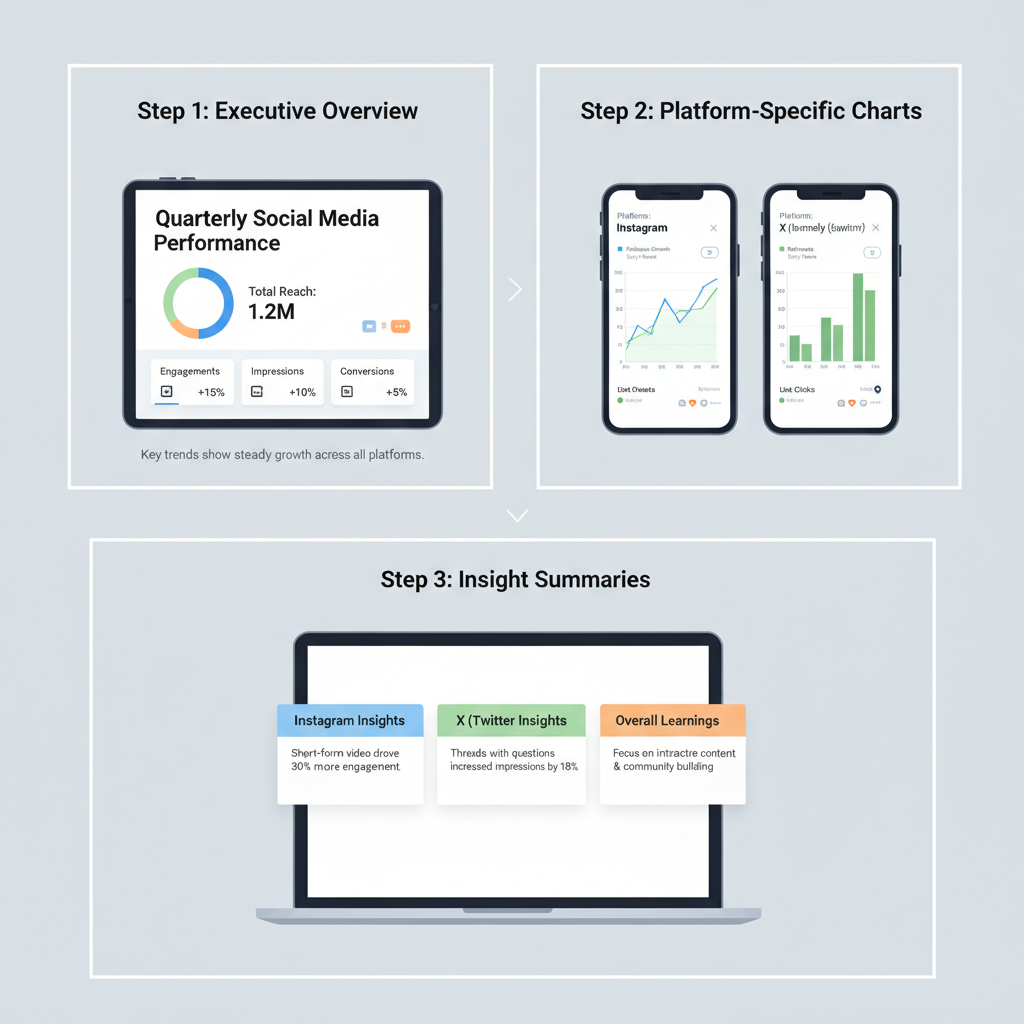
Structuring the Report for Clarity
A clear structure helps stakeholders absorb insights efficiently. Consider this format:
1. Executive Overview
Summarize progress, highlight major wins, and outline primary challenges.
2. Platform-Specific Breakdown
Offer segmented data by platform, highlighting the most relevant KPIs.
3. Performance vs Goals
Compare actual results against targets using charts or tables.
4. Trends and Patterns
Note emerging trends, content themes, and seasonal behavior shifts.
5. Data-Driven Recommendations
Provide actionable suggestions supported by the data presented.
---
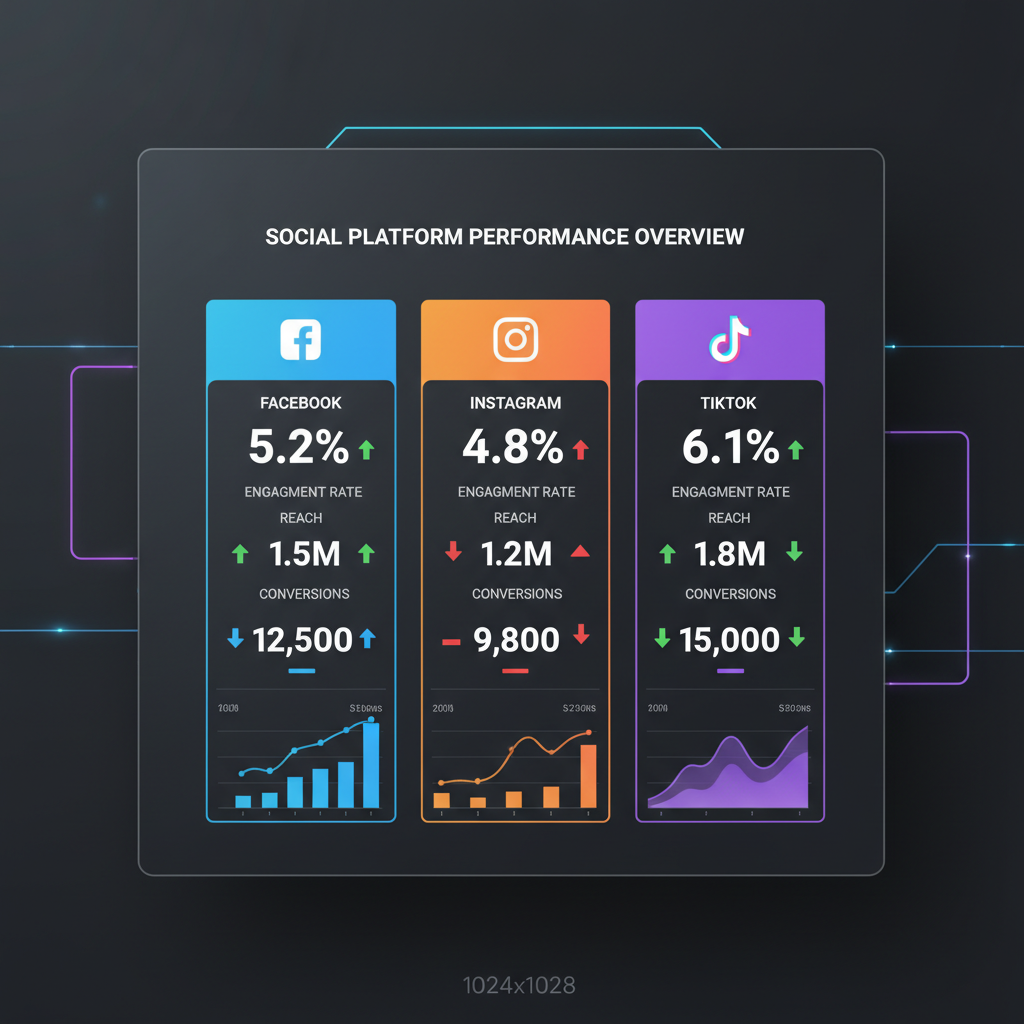
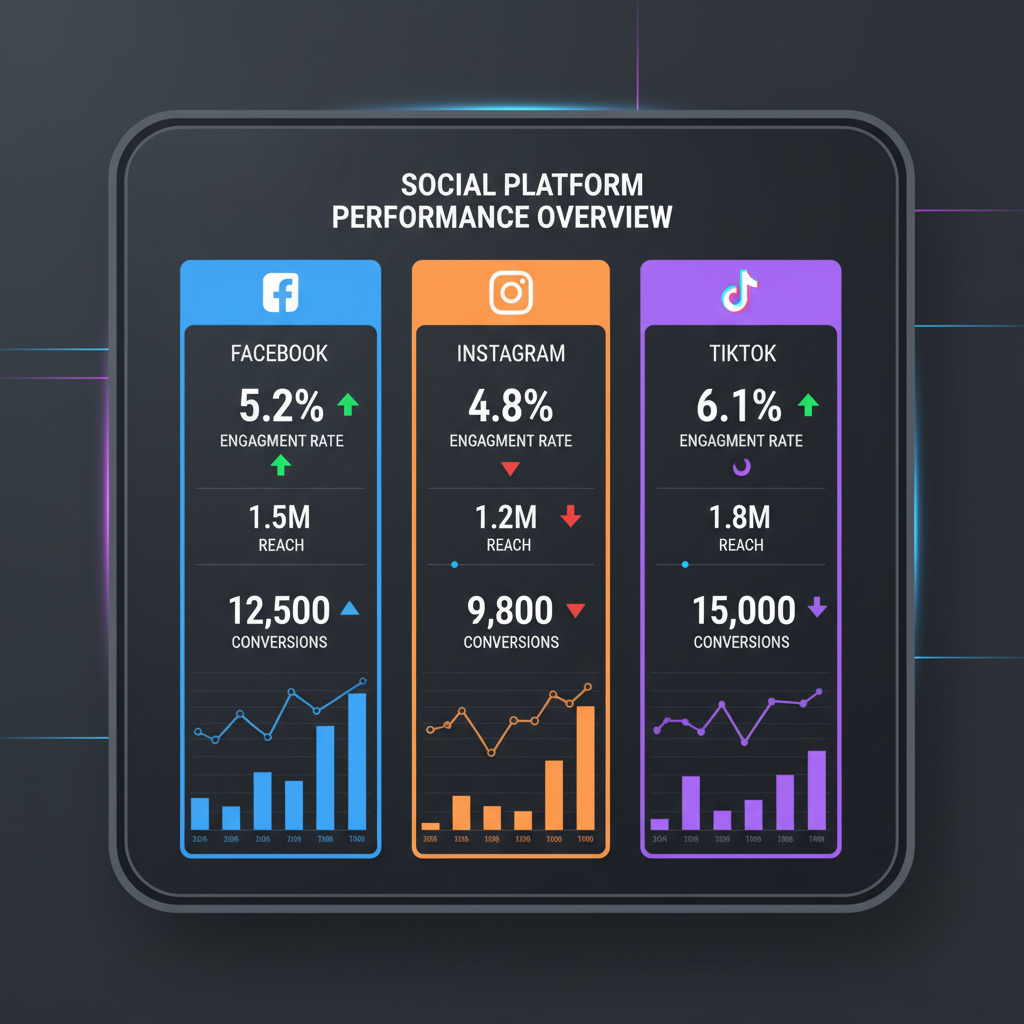
Using Visuals: Charts, Graphs, and Tables
Visual elements can make complex data easier to comprehend:
- Line charts – Show follower growth or engagement over time.
- Bar charts – Compare performance across platforms or campaigns.
- Pie charts – Illustrate traffic sources or audience segments.
Integrating visuals ensures your report is both accessible and engaging.
---
Competitor Benchmarking for Context
Adding a competitor benchmark strengthens your report:
- Choose 3–5 direct competitors.
- Gather public metrics such as follower counts, engagement rates, and posting frequency.
- Use tools like Social Blade or SEMrush for competitive analytics.
Benchmarking provides a performance baseline and uncovers market opportunities.
---
Highlighting Top-Performing Posts
Spotlight standout content for replicable success:
- Include an image or post screenshot.
- Share engagement metrics and reach.
- Offer context — what day/time it was posted, topics covered, or trends utilized.
Example:
A holiday-themed Instagram Reel doubled the average engagement rate thanks to timely posting and trending audio.
---
Evaluating Underperforming Areas
A credible social media report also addresses underperformance:
- Low reach despite frequent posting – Signals possible algorithm changes or content fatigue.
- High reach but low engagement – Suggests a need to improve relevance and calls-to-action.
- Weak conversions from social traffic – Points to potential landing page or offer issues.
This transparency builds confidence and informs improvement strategies.
---
Keeping the Report Concise, Scannable, and Actionable
Boost your report's impact with these practices:
- Use descriptive headings and bullet points.
- Keep paragraphs short for readability.
- Summarize with an Action Step at the end of each section.
Example Action Step: Increase Instagram Stories frequency to four times per week to sustain engagement growth.
---
Presenting the Report and Driving Next Steps
When presenting, walk your audience through:
- Key successes.
- Opportunities for improvement.
- Recommended next actions aligned with business goals.
This transforms static numbers into a forward-focused strategy discussion.
---
Conclusion
An expertly crafted social media report example is more than a formal document — it’s a catalyst for strategic decision-making. By defining its purpose, understanding stakeholders, selecting meaningful KPIs, and presenting findings clearly, you equip your team to optimize performance.
Commit to a consistent reporting process, and you’ll be able to fine-tune campaigns, justify your budget, and drive measurable growth from your social media investment.
Ready to take action? Start building your own social media report today using these guidelines and watch your data turn into tangible business results.