7 Social Media Report Examples for Effective Marketing
Explore 7 detailed social media report examples with key metrics, insights, and structures to measure ROI and optimize marketing strategies.
Introduction: Why Social Media Reporting Matters for Marketers and Agencies
In today’s fast-paced digital landscape, social media reporting is critical for marketers, agencies, and freelancers who need to demonstrate their value. It’s not just about collecting numbers — it’s about proving ROI, understanding audience behavior, and guiding strategy with actionable insights. Well-crafted social media report examples serve as templates or inspiration for building your own impactful documents or dashboards, helping you meet stakeholder expectations and industry benchmarks.

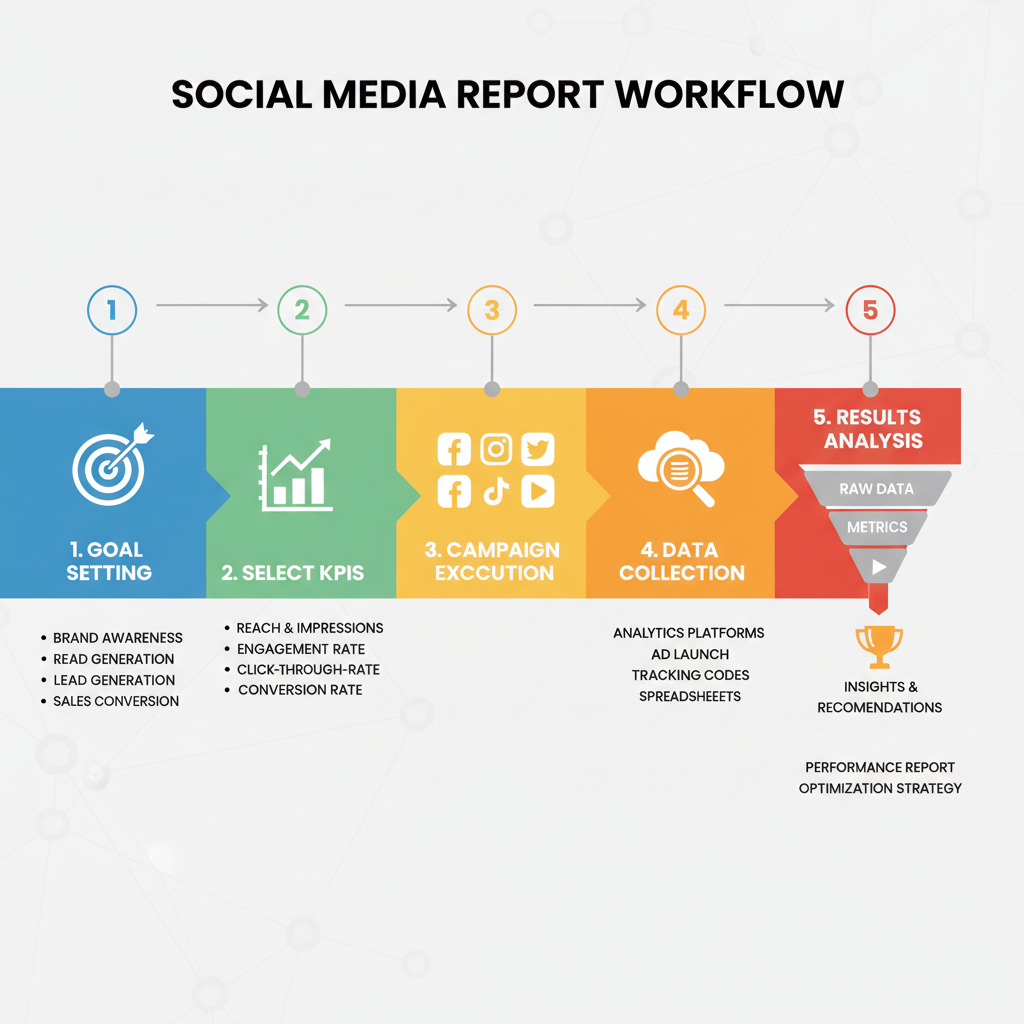
Essential Elements Every Social Media Report Should Include
Before exploring practical examples, it’s vital to understand the building blocks that make a report truly valuable. A great social media report blends quantitative metrics with qualitative insights so that decision-makers can act with confidence.
Key Components
- KPIs (Key Performance Indicators): Engagement rate, reach, impressions, follower growth, CTR, ROI.
- Visuals & Charts: Line graphs for trends, pie charts for distribution, and heatmaps for user activity.
- Insights & Analysis: Context on why trends occurred and how to replicate or improve results.
- Contextual Benchmarks: Comparisons with previous periods or industry/competitor averages.
- Action Steps: Recommendations for campaigns, budgets, and creative direction.
Including these components makes your reports decision-ready rather than just data-heavy.
---
Example #1: Monthly Social Media Performance Report
A Monthly Performance Report offers a snapshot of activity and growth across all major channels. This type suits ongoing tracking of trends and KPIs, keeping marketing initiatives aligned with business goals.
Metrics to Include
- Total followers gained/lost
- Engagement rate across channels
- Content volume (posts/videos/stories)
- Top-performing posts
- Referral traffic to your website
Benefits
This approach enables consistent trend monitoring and quick identification of wins or problem areas.
Suggested Structure:
- Executive Summary
- Monthly Performance Tables
- Channel-by-Channel Analysis
- Comparative Insights vs. Last Month
---
Example #2: Campaign-Specific Report
For targeted initiatives such as product launches or holiday sales, a Campaign-Specific Report captures performance from start to finish.
What to Measure
- Total impressions vs. campaign goals
- Clicks, conversions, and ROI
- Video ad views and completion rates
- Hashtag reach or branded keyword mentions
Why It’s Useful
It isolates performance data to accurately assess the direct impact of the campaign.
| Metric | Goal | Result | Performance vs. Goal |
|---|---|---|---|
| Reach | 500,000 | 620,000 | +24% |
| CTR | 2.5% | 3.1% | +0.6% |
| Conversions | 1,200 | 980 | -18.3% |
---
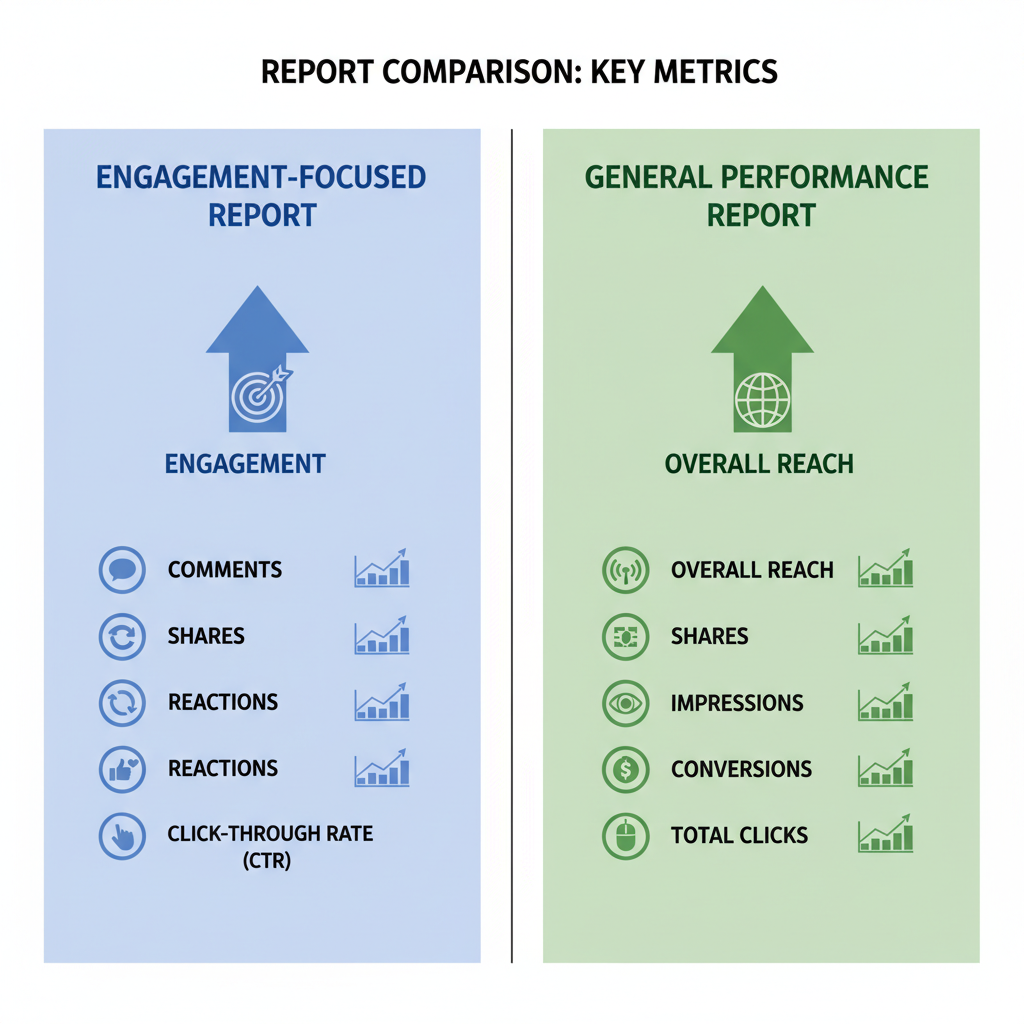
Example #3: Engagement-Focused Report
Engagement is a strong indicator of brand affinity. An Engagement-Focused Report prioritizes metrics related to how people interact with your content.
KPIs
- Engagement rate per post
- Total likes and comments over time
- Average response time to direct messages
- Volume of user-generated content mentions
Pro Tip: Separate organic engagement from paid engagement to determine the most effective strategies.
---
Example #4: Paid Ad Performance Report
When running paid social campaigns, measuring return on ad spend is critical. The Paid Ad Performance Report zeroes in on cost efficiency and conversion rates.
Metrics to Include:
- Cumulative spend vs. allocated budget
- Cost per click (CPC) and cost per thousand impressions (CPM)
- Click-through rate (CTR)
- Conversion rate and cost per acquisition (CPA)
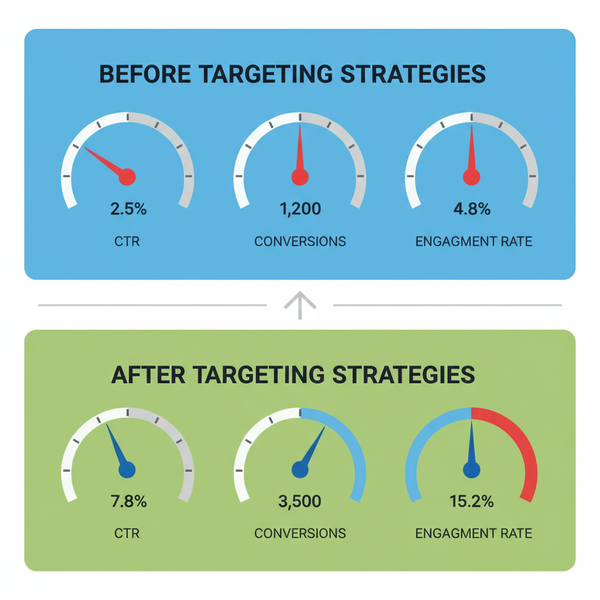
Example Insight:
If CPC is climbing while CTR stays flat, you may need to refresh creatives or refine audience targeting.
---
Example #5: Competitor Analysis Social Media Report
Benchmarking against competitors reveals valuable opportunities. A Competitor Analysis Report shows where you stand within your industry.
Key Focus Areas
- Comparative follower growth rates
- Engagement rate per post
- Mix of content formats (images, videos, carousels)
- Posting cadence and timing
Use Case:
Spot trends your competitors are leveraging and adapt them to strengthen your own content strategy.
---
Example #6: Cross-Platform Report for Multi-Channel Tracking
Brands often market on several platforms simultaneously. A Cross-Platform Report consolidates multi-channel performance into a single, comparable view.
Benefits:
- Determine which channels yield the highest ROI
- Identify audience overlaps
- Understand the distinctive strengths of each platform
Best Practices:
- Ensure consistent reporting periods
- Apply standardized metrics to compare performance fairly
---
Example #7: Content Performance Report
Different content resonates in different ways. The Content Performance Report identifies your strongest assets and trends.
Include:
- Top five posts by reach or engagement
- Results by content format (video, carousel, static image)
- Average watch duration for videos
- Seasonal or topical performance breakdowns
Why It Matters:
These insights inform your editorial calendar, ensuring more of what works and less of what doesn’t.
---
Tips for Customizing Templates for Different Stakeholders
Your reporting should match the needs and expectations of its audience.
Tips:
- Executives: Focus on ROI, conversions, and topline results.
- Marketing Teams: Include detailed campaign performance with deeper analytics.
- Clients: Use visuals, avoid technical jargon, and highlight outcomes linked to goals.
Adapting tone, depth, and presentation style ensures maximum relevance and engagement.
---
How to Present Your Reports Effectively
Choosing the right presentation format can influence stakeholder buy-in.
- Dashboards: Real-time tracking via tools like Google Data Studio or Power BI.
- PDF Reports: Formal, shareable documents ideal for archiving.
- Slide Decks: Concise meeting presentations with key takeaways.
- Interactive Charts: Enable deeper exploration of individual metrics.
Pro Tip: Optimize layouts for both desktop and mobile to ensure accessibility.
---
Conclusion: Using Report Insights to Influence Future Strategy
Studying and applying these 7 social media report examples enables marketers, agencies, and freelancers to produce reports that inform strategy and enhance performance. When reports provide meaningful insights, they:
- Build audience understanding
- Optimize budget allocation
- Sharpen creative direction
- Align marketing with business objectives
Social media reports are more than simple data collections — they are strategic assets. Embrace regular, well-structured reporting to elevate results, satisfy stakeholders, and drive sustained brand growth.
Ready to take your reporting to the next level? Start integrating these example structures into your own templates today to make your data both insightful and actionable.