Track and Analyze Tweet Stats to Boost Engagement
Learn how to track and analyze tweet stats, optimize posting times, and measure hashtag performance to boost engagement and grow your Twitter presence.

Track and Analyze Tweet Stats to Boost Engagement
Tracking and analyzing tweet stats is a vital practice for brands, marketers, and content creators aiming to grow their Twitter presence and increase engagement. By understanding the data behind each tweet — from impressions to click-through rates — you can refine your approach, connect better with your audience, and achieve measurable results. This guide walks you through what tweet stats include, how to monitor them effectively, and ways to turn analytics into actionable strategies for ongoing improvement.
---
Understanding What Tweet Stats Are
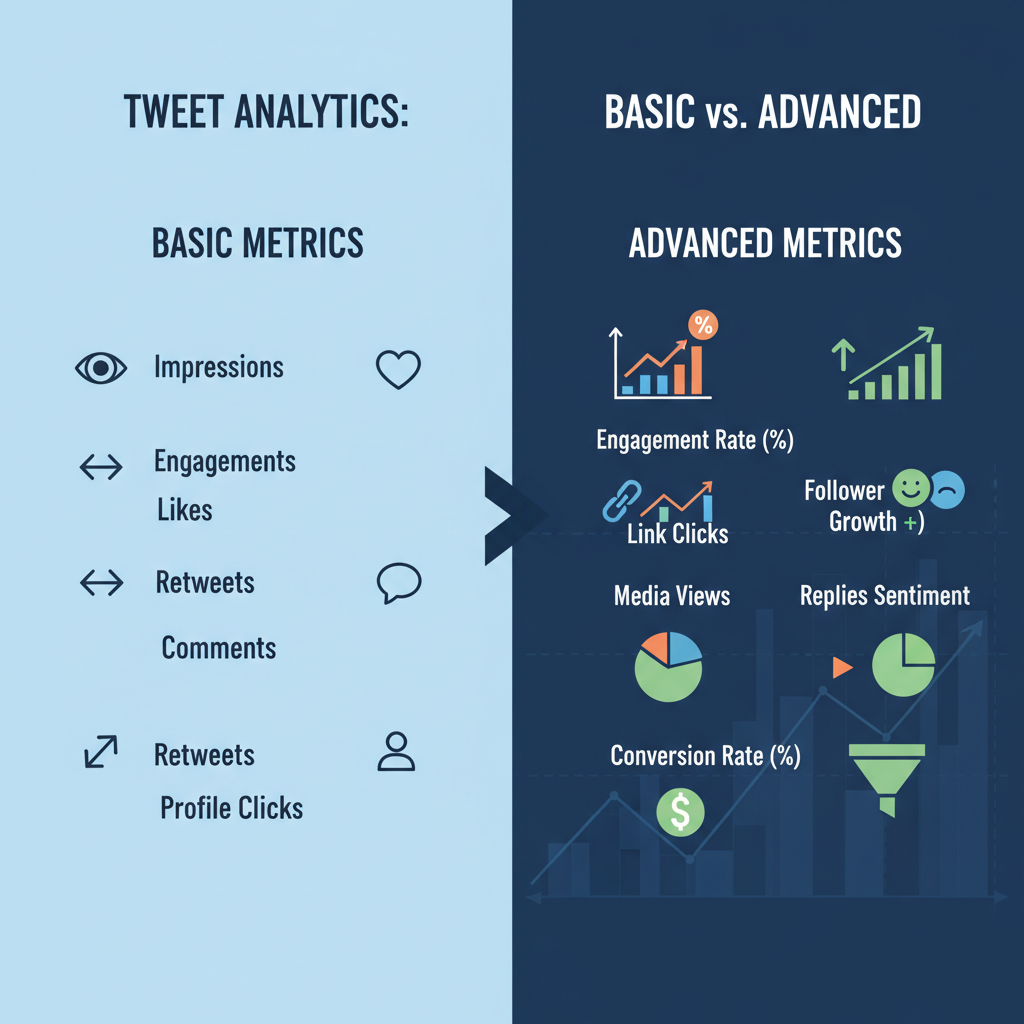
Tweet stats represent measurable data tied to the performance of your tweets. The primary components include:
- Engagement – Any interaction: likes, replies, retweets, profile clicks, and link clicks.
- Impressions – How many times your tweet was displayed.
- Click-Through Rate (CTR) – The percentage of impressions that resulted in a click.
- Reach – The count of unique users who viewed your tweet.
Clear definitions create a base for effective performance analysis.
---
Set Clear Objectives for Tracking
Before gathering data, define your goals so you focus on metrics that support your strategy. Common objectives include:
- Brand Awareness – Monitor impressions, reach, and mentions.
- Conversions – Measure link clicks and conversion rates using UTM extensions.
- Community Growth – Track follower increases and engagement ratios.
Goal clarity helps avoid being misled by vanity metrics that don’t deliver tangible outcomes.
---
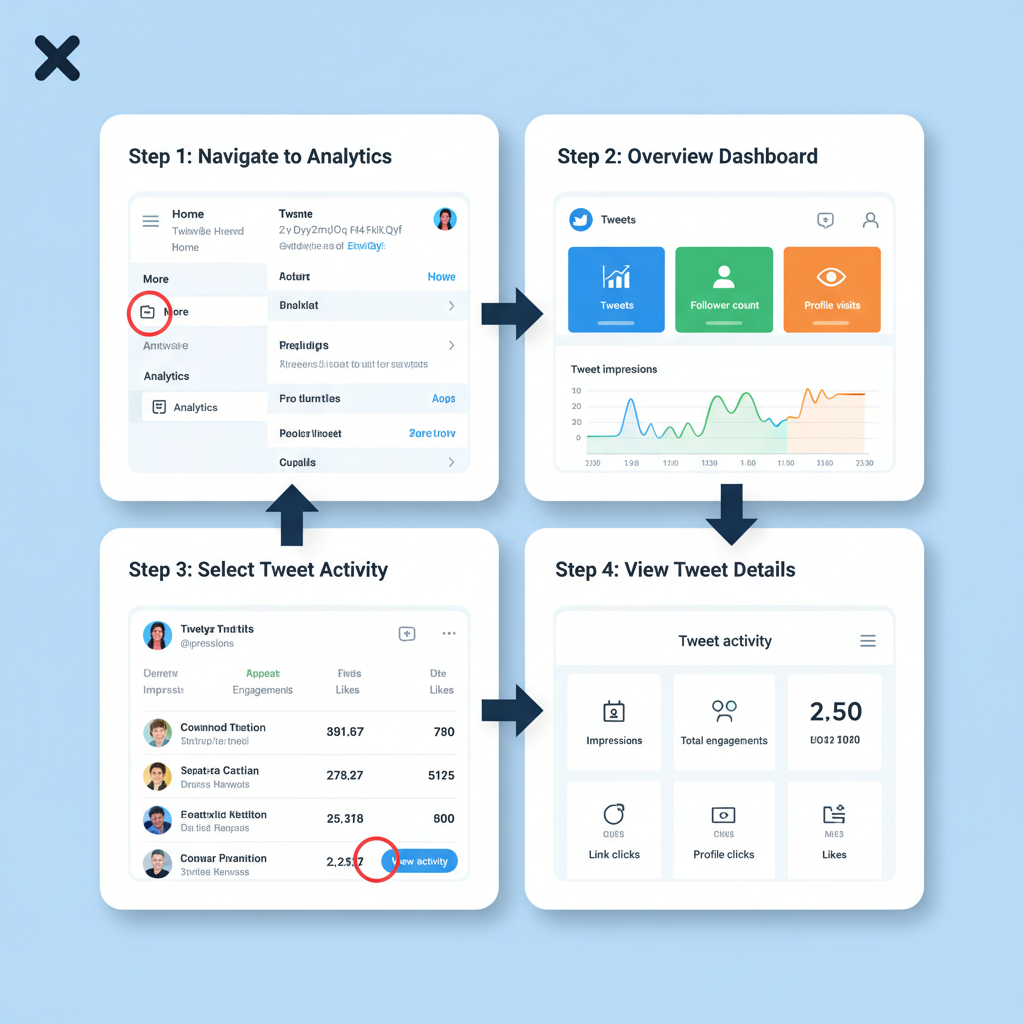
Use the Twitter Analytics Dashboard
Twitter’s native Analytics Dashboard is a free, accessible tool for measuring tweet stats. It offers:
- A timeline view of tweet impressions.
- Detailed engagement metrics for each tweet.
- Insights into your audience’s interests and demographics.
Start here to gain fundamental metric knowledge before employing more advanced analytics solutions.
---
Track Advanced Metrics With Third-Party Tools
To dig deeper into performance trends, use platforms such as:
- Sprout Social – Covers scheduling, social listening, and comprehensive reporting.
- Buffer – Simplifies scheduling and engagement monitoring.
- Hootsuite – Offers robust analytics and team collaboration tools.
These tools enable:
- Historical data beyond Twitter’s default limits.
- Side-by-side comparisons across networks.
- Custom analytics reporting options.
---
Break Down Engagement Types
For granular insight, segment engagement data into:
- Likes – Show appreciation but may not expand reach.
- Retweets – Increase exposure by sharing with new audiences.
- Replies – Encourage conversation and community interaction.
- Profile Clicks – Indicate interest in learning more about you.
This breakdown aids in shaping targeted content strategies.
---
Identify Top-Performing Tweets
Pinpoint your strongest tweets using engagement rate (engagements ÷ impressions × 100). Remember to assess relevance too — a humorous viral post may not support lead generation.
Process:
- Export tweet data from Twitter Analytics.
- Calculate engagement rates in Excel or Google Sheets.
- Sort in descending order to reveal top performers.
---
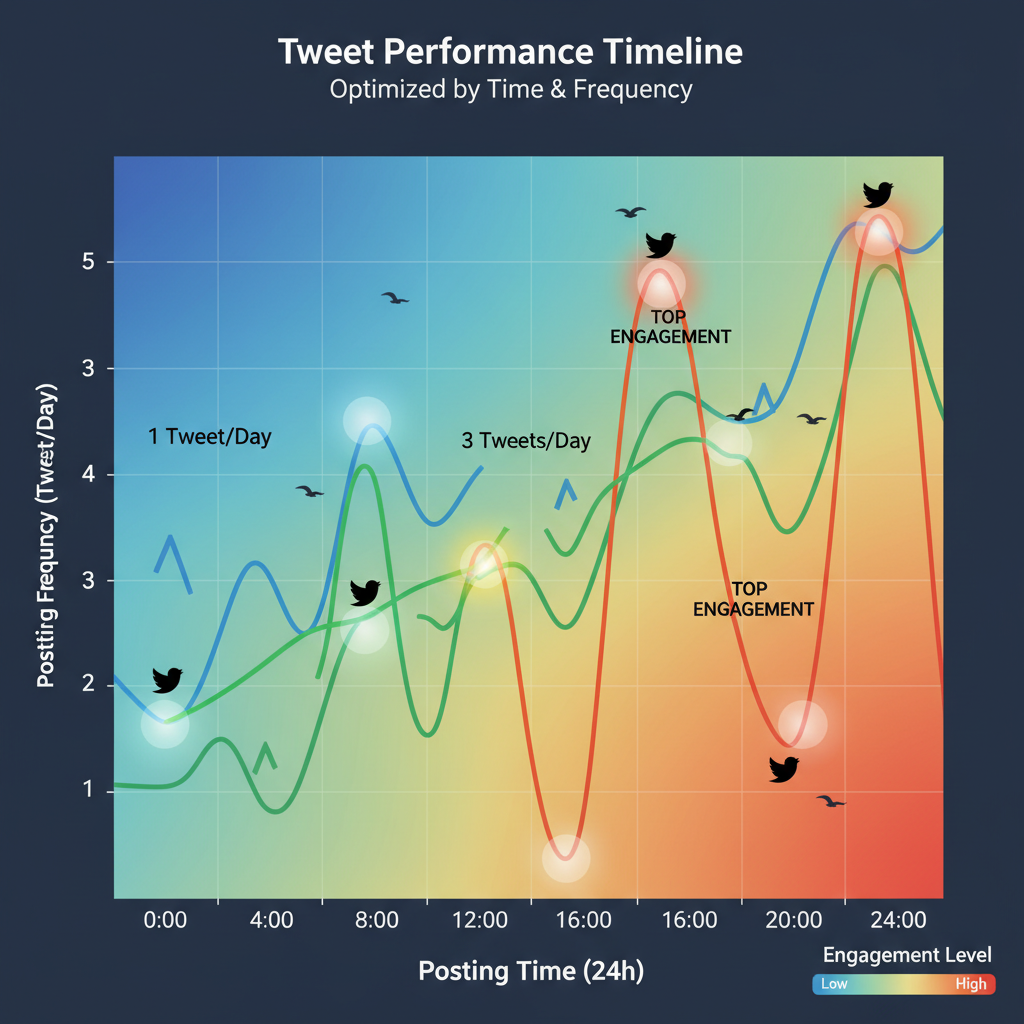
Analyze Posting Times and Frequency
Timing significantly impacts tweet performance. Use analytics to uncover activity peaks.
Best practices:
- Test different posting hours and days.
- Schedule tweets for high-activity periods.
- Publish consistently without overwhelming your audience.
---
Monitor Hashtag Performance
Hashtags broaden reach and tie tweets to trending topics. Evaluate:
- Impressions driven by specific hashtags.
- CTR improvements linked to hashtag use.
- Impact of joining trending conversations.
Third-party analytics can pinpoint the hashtags with the highest returns.
---
Compare Organic vs Promoted Tweet Data
Paid promotions can boost impressions but not always engagement quality. Compare results to evaluate ROI:
| Metric | Organic Tweet | Promoted Tweet |
|---|---|---|
| Impressions | 4,500 | 12,000 |
| Engagement Rate | 4.1% | 3.5% |
| Link Clicks | 180 | 320 |
| CTR | 4.0% | 2.7% |
These insights guide smarter investment in promoted content.
---
Use UTM Parameters to Track Website Traffic
UTM tags in tweet links make it easy to map clicks to conversions. Example:
https://yourdomain.com/landing-page?utm_source=twitter&utm_medium=tweet&utm_campaign=spring_saleSuch parameters integrate with Google Analytics for full tracking from click to outcome.
---
Benchmark Against Industry Averages
Measure your tweet stats against industry standards to gauge effectiveness:
| Industry | Avg Engagement Rate | Avg CTR |
|---|---|---|
| Retail | 2.5% | 1.6% |
| Tech | 3.2% | 2.1% |
| Media | 4.0% | 1.8% |
Falling below benchmarks suggests a need to adjust targeting or content style.
---
Create Monthly Reports and Action Plans
Monthly analysis should include:
- Key metric summaries – Impressions, engagement rate, CTR.
- Top-performing tweets – And why they succeeded.
- Performance by tweet format.
- Action recommendations.
This systematic approach ensures consistent improvement.
---
Experiment With Content Formats
Diversify tweet formats to discover audience preferences:
- Threads – Tell stories or deliver in-depth insights.
- Polls – Encourage direct interaction.
- Visual posts – Images, videos, and GIFs typically attract more attention.
Track changes in your tweet stats after each test.
---
Adjust Strategy Based on Trends
Spot and act on trends using rolling averages:
- Dropping engagement rates may hint at overposting.
- CTR gains can reflect better calls-to-action or teaser design.
Adapt posting times, message tone, and targeting to maintain momentum.
---
Avoid the Vanity Metrics Trap
Numbers like views and followers can be misleading if they don’t align with your goals. Focus on stats that contribute directly to conversions or substantive engagement to maximize ROI.
---
Summary and Next Steps
Tweet stats offer a roadmap to Twitter success when tracked and interpreted strategically. A steady cycle of monitoring, analyzing, and optimizing — supported by clear objectives and the right tools — will reveal which content performs best, when to post for maximum engagement, and how hashtags amplify reach.
Take your insights and convert them into action. Start applying data-driven tweaks to your tweets today, and watch your engagement and conversion rates climb.