Using a Twitter Analytics Account to Increase Engagement
Learn how to use Twitter Analytics to monitor key metrics, understand your audience, and time posts strategically to boost engagement and growth.
Introduction to Twitter Analytics
A Twitter Analytics account is a free, built‑in tool from Twitter that allows individuals, brands, and businesses to track and improve their performance on the platform. Whether you’re aiming to increase engagement, drive website traffic, or grow a loyal audience, these analytics reveal key data about impressions, engagement, follower growth, demographics, and more. Understanding and acting on this information is essential for developing a content strategy that resonates with your target audience.
For marketers, influencers, and social media managers, learning how to interpret and apply Twitter Analytics insights isn’t just a nice‑to‑have skill—it’s the foundation for achieving measurable growth.

---
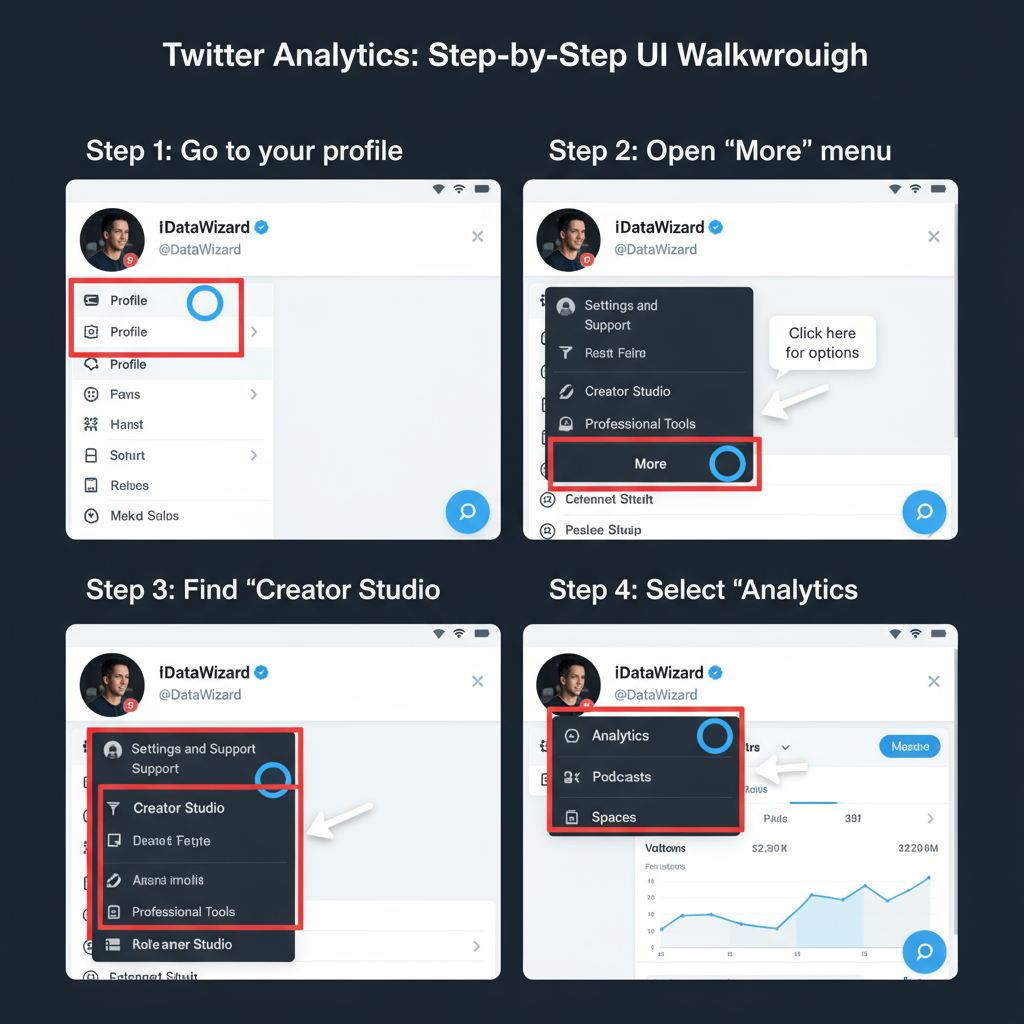
How to Access Your Twitter Analytics Account
Getting started with Twitter Analytics is straightforward:
- Log in to your Twitter account.
- Click on your profile picture in the top‑right corner.
- Select Analytics from the dropdown menu, or go directly to analytics.twitter.com.
- Make sure analytics tracking is switched on.
You’ll land on the Account Home dashboard, which summarizes your recent Twitter activity and performance metrics.
---
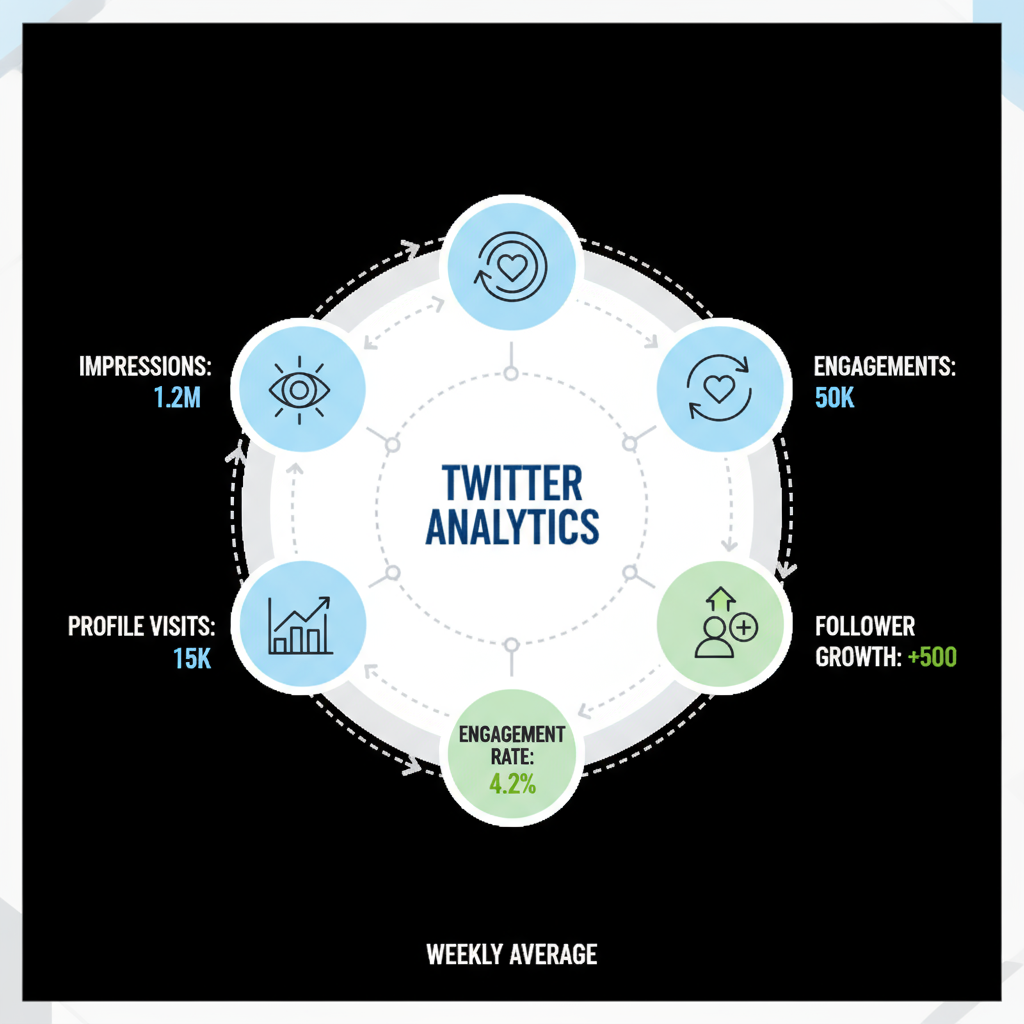
Key Metrics to Monitor
Monitoring the right metrics in your Twitter Analytics account will help guide your strategic decisions. The most important include:
- Impressions – How many times a tweet is displayed.
- Engagement Rate – Interactions divided by impressions, including likes, retweets, replies, and clicks.
- Profile Visits – How many times people clicked to view your profile.
- Followers – Net growth or loss in your follower count over time.
| Metric | Definition | Why It Matters |
|---|---|---|
| Impressions | Total times a tweet is displayed | Measures content visibility |
| Engagement Rate | Interactions per impression | Indicates audience interest |
| Profile Visits | Number of profile page views | Reflects curiosity about your brand |
| Followers | Net change in followers | Tracks community growth |
---
Understanding the Tweet Activity Dashboard
The Tweet Activity Dashboard provides detailed, tweet‑by‑tweet performance data. You can sort and filter tweets by impressions, engagement rate, or total engagements, enabling you to:
- Identify your top‑performing tweets.
- Spot low‑engagement posts for improvement.
- Compare the effectiveness of different messaging styles.
---
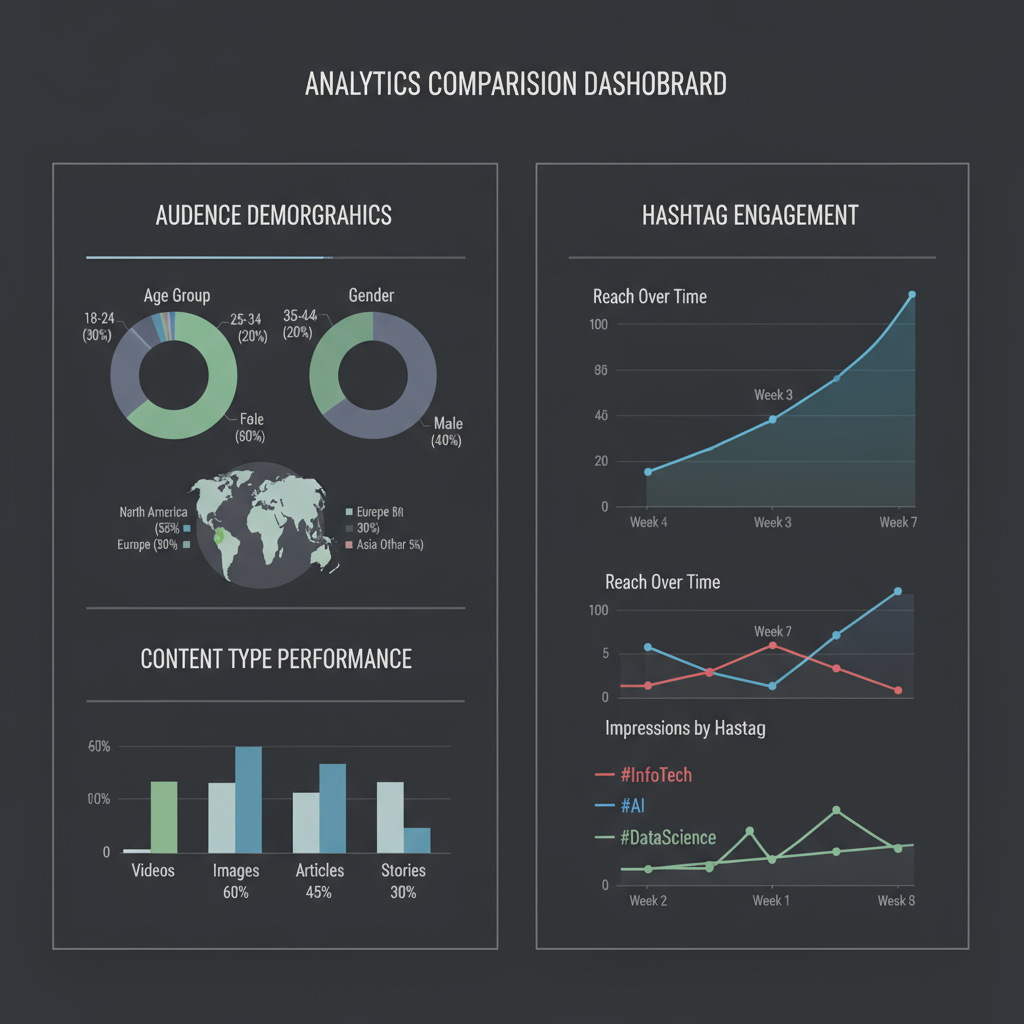
Segmenting Data by Content Type
Breaking down your analytics by content type uncovers useful trends:
- Tweets – Standard posts without @replies.
- Replies – Direct responses to other accounts.
- Media – Posts containing images, GIFs, or videos.
- Links – Posts that include a URL.
This segmentation might reveal, for example, that tweets containing video clips get twice the engagement of those with only text.
---
Tracking Audience Demographics and Interests
Your Twitter Analytics account offers audience demographic insights such as:
- Gender distribution
- Top geographic locations
- Primary languages
- Top interests
With this knowledge, you can tailor your tweets. For instance, if your audience is largely interested in technology and is based in a specific region, you can adjust your content themes and posting schedule accordingly.
---
Identifying Best Posting Times from Analytics Insights
Using analytics data, you can pinpoint the best times to post by:
- Reviewing performance over the last 28 days.
- Noting recurring high‑engagement periods.
- Scheduling tweets for those slots to maximize visibility.
Posting at the right time often means the difference between being overlooked and trending in your niche.
---
Measuring Hashtag Performance
Hashtags can increase reach, but effectiveness varies. Use Twitter Analytics to:
- Compare performance of tweets with and without hashtags.
- Track results for specific campaign hashtags.
- Eliminate hashtags that contribute little to engagement.
---
Using Analytics to A/B Test Tweet Formats and CTAs
A/B testing means creating two variations of a tweet that differ in a single element (such as CTA, image, or headline). Then:
- Monitor impressions, clicks, and engagements for both versions.
- Identify which version performs better.
- Apply these findings to future content.
Example:
- Version A: “Check out our latest blog post! 📚”
- Version B: “Boost your marketing skills with our newest guide—read now 👉”
Analytics will reveal which attracted more engagement or clicks.
---
Aligning Twitter Analytics Insights with Marketing Goals
Tie your analytics back to your marketing objectives:
- If the goal is increasing website traffic: focus on tweets with links, track click‑through rates, and revise copy to boost CTR.
- If the goal is building brand awareness: monitor follower growth and impressions, using engagement rate as a secondary metric.
---
Common Mistakes to Avoid in Analytics Interpretation
Avoid these frequent errors:
- Chasing vanity metrics – High impressions without conversions won’t meet most goals.
- Basing conclusions on a single tweet – Ensure a meaningful sample size.
- Overlooking external factors – News events or trends can skew data.
- Not segmenting content types – Aggregated metrics can hide important details.
---
Recommended Tools to Extend Native Twitter Analytics Capabilities
The native Twitter Analytics account is robust but limited. Consider pairing it with:
- Hootsuite Analytics – Multi‑channel integration and scheduling.
- Sprout Social – Advanced reporting and collaboration.
- Buffer Analyze – Campaign tracking with an intuitive interface.
- Followerwonk – In‑depth follower insights.
---
Monthly Analytics Reporting Template Example
Use this structure for a comprehensive monthly analysis:
| Section | Content |
|---|---|
| Overview | Total impressions, engagements, follower growth |
| Top Tweets | List top 5 tweets by engagement rate |
| Audience Insights | Top demographics, interests, and locations |
| Content-Type Breakdown | Performance comparison for tweets, media, links, replies |
| Hashtag Performance | Best and worst performing hashtags |
| Next Month's Action Plan | Strategies and adjustments based on insights |
---
Conclusion and Next Steps for Continuous Improvement
Maximizing the value of your Twitter Analytics account requires regular monitoring, experimentation, and alignment with your broader marketing goals. By reviewing metrics weekly, segmenting results by content type, A/B testing calls‑to‑action, and refining posting schedules, you can create relevant, high‑performing content.
Next steps:
- Review analytics consistently.
- Test new tweet formats monthly.
- Optimize hashtags and posting times based on data.
- Translate insights into strategy adjustments.
Twitter’s fast pace rewards those who stay agile. If you want sustained growth and engagement, make Twitter Analytics an integral part of your social media workflow—starting today.