Twitter Analytics for Another Account: Methods and Tools
Learn how to analyze another Twitter account using public data, third-party tools, and competitive benchmarks while staying within policy limits.

Understanding Twitter Analytics Limitations for Non-Owners
If you are trying to perform Twitter analytics for another account, it’s important to understand both the possibilities and the limits before you start. Twitter’s official analytics dashboard is exclusive to the account owner or an authorized manager, meaning you cannot view private statistics like impressions, link clicks, or audience demographics directly.
Key private metrics unavailable to non-owners include:
- Impressions
- Profile visits
- Click-through rates
- Audience interests
These restrictions exist due to Twitter’s privacy policies and API limitations, which protect user data and prevent unauthorized access.
Still, with the right approach, you can run a valuable analysis using publicly available data points without violating Twitter’s terms of service.
---
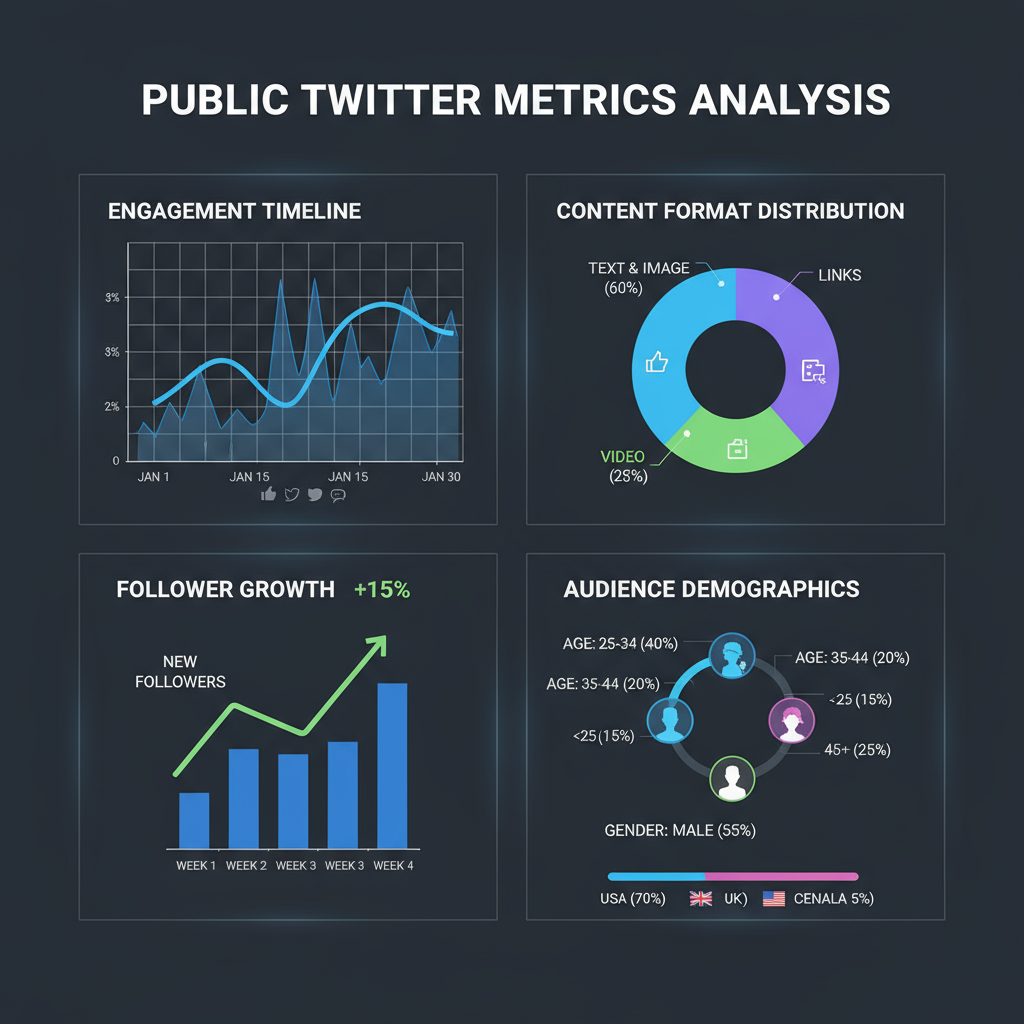
Exploring Publicly Visible Metrics
You may not have access to everything, but publicly visible metrics provide enough material for meaningful analysis.
Key Public Metrics
- Likes – Gauge how appealing a tweet is to the audience.
- Retweets – Reveal shareability and content virality potential.
- Replies – Indicate conversational engagement and interest in dialogue.
- Followers – Demonstrate the size and potential reach of the account.
By recording and tracking these over time, patterns emerge that can inform competitive research and content strategy.
---
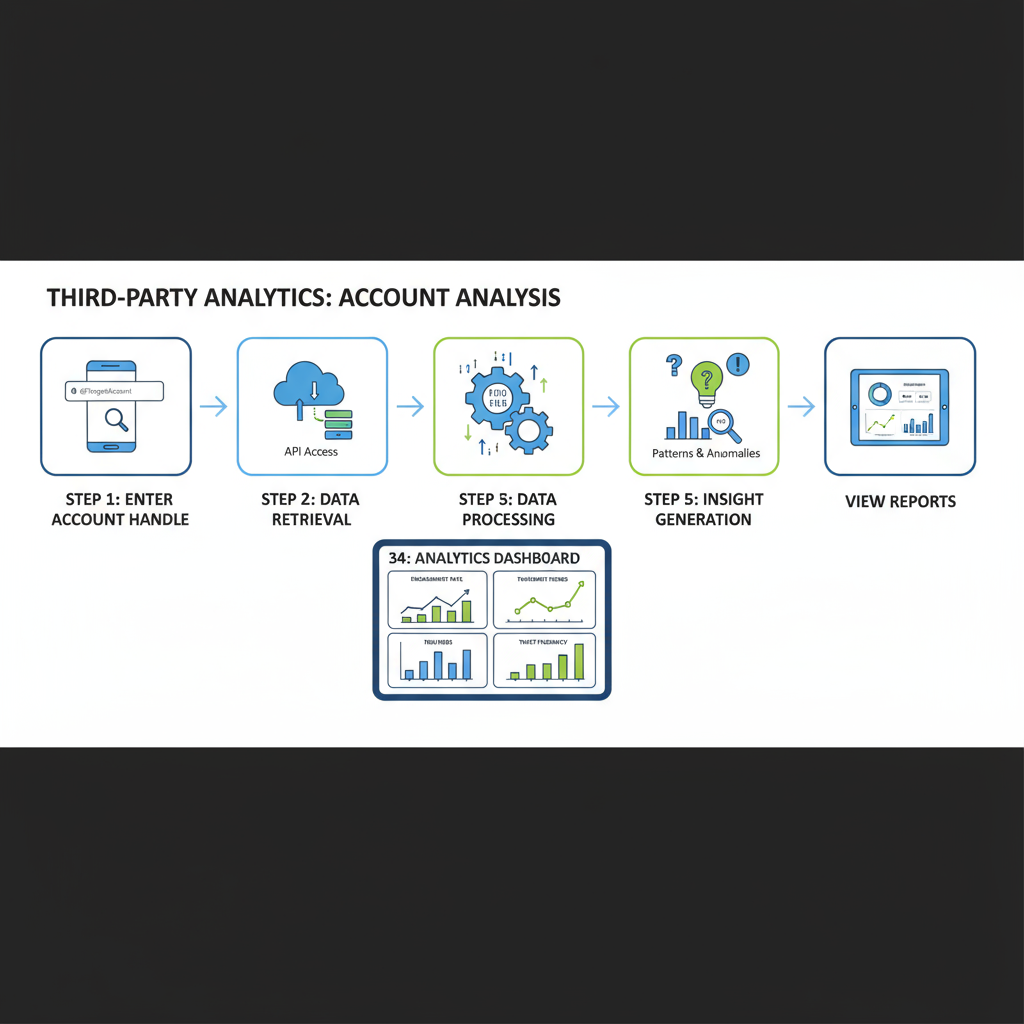
Using Third-Party Tools for Public Account Analysis
Third-party platforms help you interpret public Twitter data — as long as they comply with Twitter’s rules.
Popular Options Include:
- Twitonomy – Analysis of retweets, replies, hashtags, and more.
- Followerwonk – Advanced tools for follower analysis and bios.
- Social Blade – Tracks follower growth and estimates engagement.
- Rival IQ – Enables benchmarking between accounts in your sector.
⚠ Tip: Always ensure a tool operates within Twitter’s developer policy to avoid compliance issues.
---
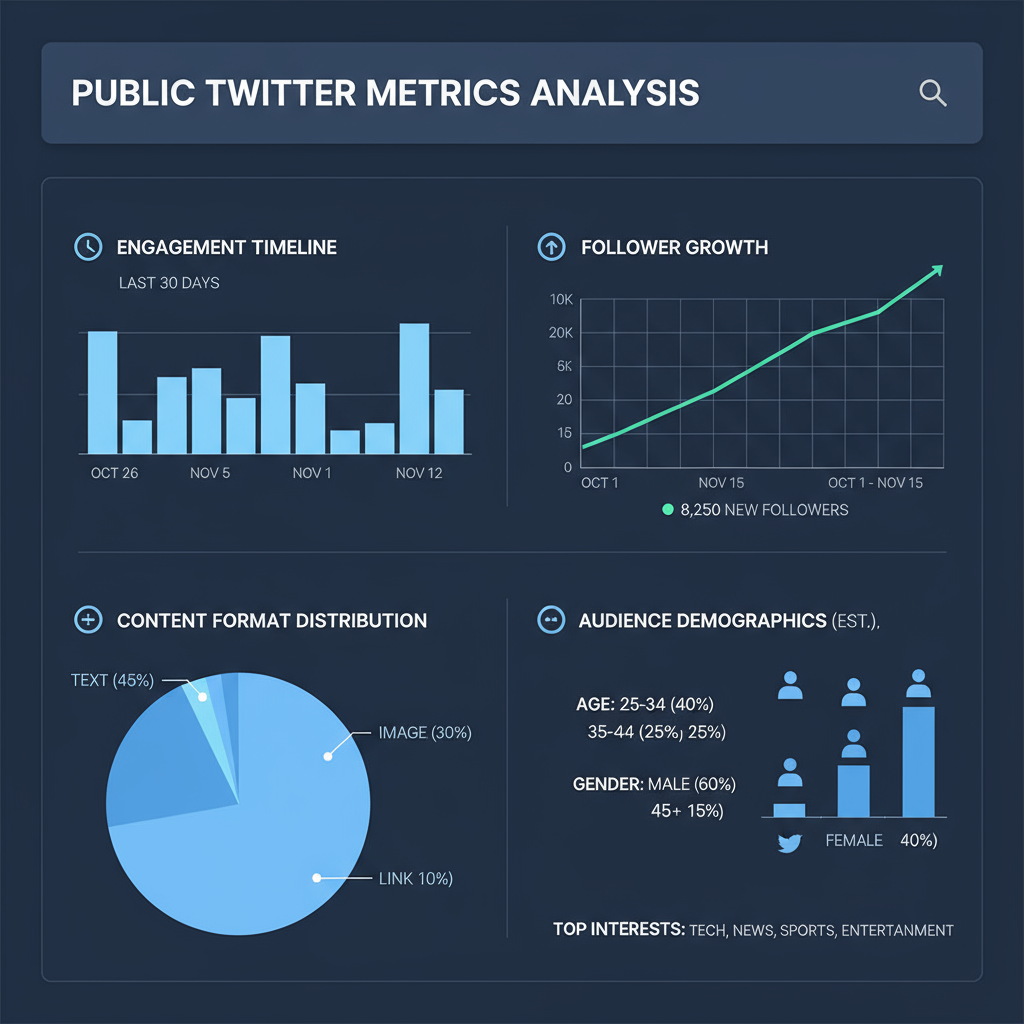
Analyzing Tweet Frequency, Engagement Rates, and Content Formats
Different posting strategies produce varying engagement patterns. Look at how often an account tweets and what formats are used, such as:
- Text-only updates
- Image-based tweets
- Videos
- Polls
- Quote tweets
You can also calculate a public engagement rate approximation:
Engagement Rate = (Likes + Retweets + Replies) / Followers * 100While not exact, this provides a useful comparative benchmark.
---
Tracking Follower Growth and Demographics
Observing Growth Patterns
Follower count changes are visible to everyone. Track weekly or monthly snapshots or use tools like Social Blade to visualize trends.
Understanding Audience Signals
You can estimate demographics via:
- Bio keywords
- Location tags in tweets
- Language patterns in posts
Note: These figures are directional estimates and should not be treated as exact.
---
Monitoring Hashtag Performance and Trending Topics from Target Accounts
Hashtag analysis can provide deeper insight into content performance.
Steps to Monitor:
- Build a list of the account’s regularly used hashtags.
- Track individual hashtag engagement over time.
- Identify those tied to above-average interaction.
Pair this with trending topic research via Twitter’s Explore tab or external trackers like Hashtags.org.
---
Comparing Analytics Across Multiple Accounts for Benchmarking
Benchmarking helps you understand performance in a competitive context.
Example Competitive Metrics Comparison
| Metric | Account A | Account B | Account C |
|---|---|---|---|
| Average Tweets/Week | 25 | 15 | 30 |
| Average Engagement Rate | 4.5% | 2.8% | 5.0% |
| Follower Growth (Monthly) | +800 | +500 | +1,000 |
Comparing this data reveals what works well for others and where you might close performance gaps.
---
Best Practices for Ethical and Compliant Social Media Analysis
- Use only public, visible data.
- Avoid scraping methods that breach platform guidelines.
- Attribute sources when sharing data publicly.
- Respect privacy — avoid making granular assumptions about identifiable users.
Compliance ensures credibility and avoids the risk of losing access to important tools.
---
Tips for Creating Reports and Visualizations from Collected Data
Turning raw numbers into clear, actionable visuals makes insights more impactful.
Recommended Tools:
- Google Data Studio – Free, easy-to-share dashboards.
- Tableau – Highly customizable and interactive charts.
- Excel / Google Sheets – Flexible spreadsheet-based analytics.
Visualization Ideas:
- Line graph for follower growth trends.
- Bar chart for tweet format engagement comparisons.
- Pie chart of hashtag usage distribution.
---
Mistakes to Avoid When Interpreting Public Engagement Metrics
- Assuming causation from correlation — engagement changes may be seasonal or topical.
- Ignoring context of timing — global events and posting schedule impact results.
- Allowing viral anomalies to skew averages — use median metrics where possible.
A measured approach ensures that insights remain actionable and accurate.
---
Summary
Even without access to an account’s private Twitter analytics, you can perform insightful Twitter analytics for another account using public metrics and compliant tools. By focusing on tweet frequency, formats, engagement, hashtags, follower trends, and competitive benchmarking, you can interpret growth patterns and strategy effectiveness ethically.
If you’re ready to start monitoring competitors or influencers the right way, begin by selecting a compliant third-party tool and setting a consistent data collection schedule. Over time, your analysis will yield better content decisions and stronger strategy alignment.