Twitter (X) Analytics for Free: A Practical Guide to Tracking What Matters
Track what matters on X (Twitter) without paying. This practical guide shows free analytics workflows, key metrics, and simple tools to drive results.

Effective social media measurement doesn’t have to be expensive or complicated. With the free analytics built into X (formerly Twitter), a simple spreadsheet, and a few freemium tools, you can build a reliable feedback loop that drives smarter content decisions. This formatting-optimized guide shows you how to capture the right metrics, create a no-cost workflow, and connect on-platform results to real business outcomes.
Twitter (X) Analytics for Free: A Practical Guide to Tracking What Matters

If you’re a creator, marketer, or startup trying to grow on a shoestring, twitter analytics free options are better than you might think. With a disciplined workflow, the built-in numbers from X, a couple of spreadsheets, and a few freemium tools, you can measure what matters and make better content decisions—without paying for a platform or the API.
This guide shows you exactly how to do that.
---
Why X analytics matters (especially when it’s free)
Free measurement helps you:
- Spot winning topics and formats so you can double down without guesswork.
- Improve conversion paths by learning which posts and CTAs drive clicks.
- Benchmark progress against peers to set realistic targets.
- Communicate outcomes to stakeholders with a simple, repeatable report.
- Build a feedback loop so your next 10 posts outperform your last 10.
The payoff: Faster learning and better results, even if your budget is $0.
---
What you get from X’s built-in (free) analytics
Where to find analytics on desktop and mobile
- Web (desktop):
- Per-post: Open any of your posts and click “View post analytics” (bar-chart icon).
- Profile-level: Some accounts see an “Analytics” option in the left sidebar (More > Analytics) or a “Professional Tools” panel with basic insights. Availability varies by region/account type.
- Mobile (iOS/Android):
- Per-post: Tap the bar-chart icon under your own post to see impressions, engagement rate, and more.
Tip: If you don’t see a dedicated Analytics page, you can still gather what you need via per-post analytics, profile insights (where available), and manual logs.
Key metrics available and what they mean
| Metric | What it means | Where to find | Notes / Limitations |
|---|---|---|---|
| Impressions | Times your post was shown on X. | Per-post analytics | Owner-only; not available for competitors’ posts. |
| Engagements | Total interactions (likes, reposts, replies, detail expands, etc.). | Per-post analytics | Definition can evolve; check the breakdown in the UI. |
| Engagement rate | Engagements divided by impressions. | Per-post analytics | Useful for apples-to-apples post comparisons. |
| Profile visits | Number of profile page views in a period. | Profile insights (where available) | Good directional indicator of interest. |
| Link clicks | Clicks on URLs in your post. | Per-post analytics | Owner-only; validate with UTM + GA4 on your site. |
| Top Post | Your highest-performing post in a period. | Profile insights (where available) | Quick way to find what to replicate. |
| Follower count | Total followers at a point in time. | Profile page | Use with caution; growth rate is more informative. |
Current limitations to expect
- History windows can be limited; exporting is inconsistent.
- No competitor analytics inside X.
- Audience demographic data is sparse unless you’re using paid or ads tools.
- No multi-post comparisons or custom dashboards natively.
---
Metrics that actually move the needle
Not all numbers are equal. Focus on a small set that ties to outcomes.
- Reach vs. engagement
- Reach proxy on X: Impressions (how many times your post was shown).
- Engagement: Likes, reposts, replies, link clicks, profile visits.
- Engagement rate per post
- Formula: Engagements / Impressions.
- Why it matters: Normalizes performance across posts with different reach.
- Link clicks and CTR (click-through rate)
- CTR per post = Link Clicks / Impressions.
- Validates whether your copy and preview drive action, not just attention.
- Follower growth rate
- Growth rate = New Followers in Period / Starting Followers.
- Better than raw follower count (a vanity metric) because it reflects momentum.
- Beware vanity metrics
- High impressions without clicks can indicate weak targeting or CTA.
- Likes without profile visits or follows can signal misaligned content.
Example Google Sheets formulas (assuming columns):
- A: Date, B: Post URL, C: Impressions, D: Engagements, E: Link Clicks, F: Followers (start)
Engagement Rate (G2) =IFERROR(D2/C2,0)
CTR (H2) =IFERROR(E2/C2,0)
Follower Growth Rate (I2) =IFERROR((F3-F2)/F2,0)  // if F3 is next period's followers
---
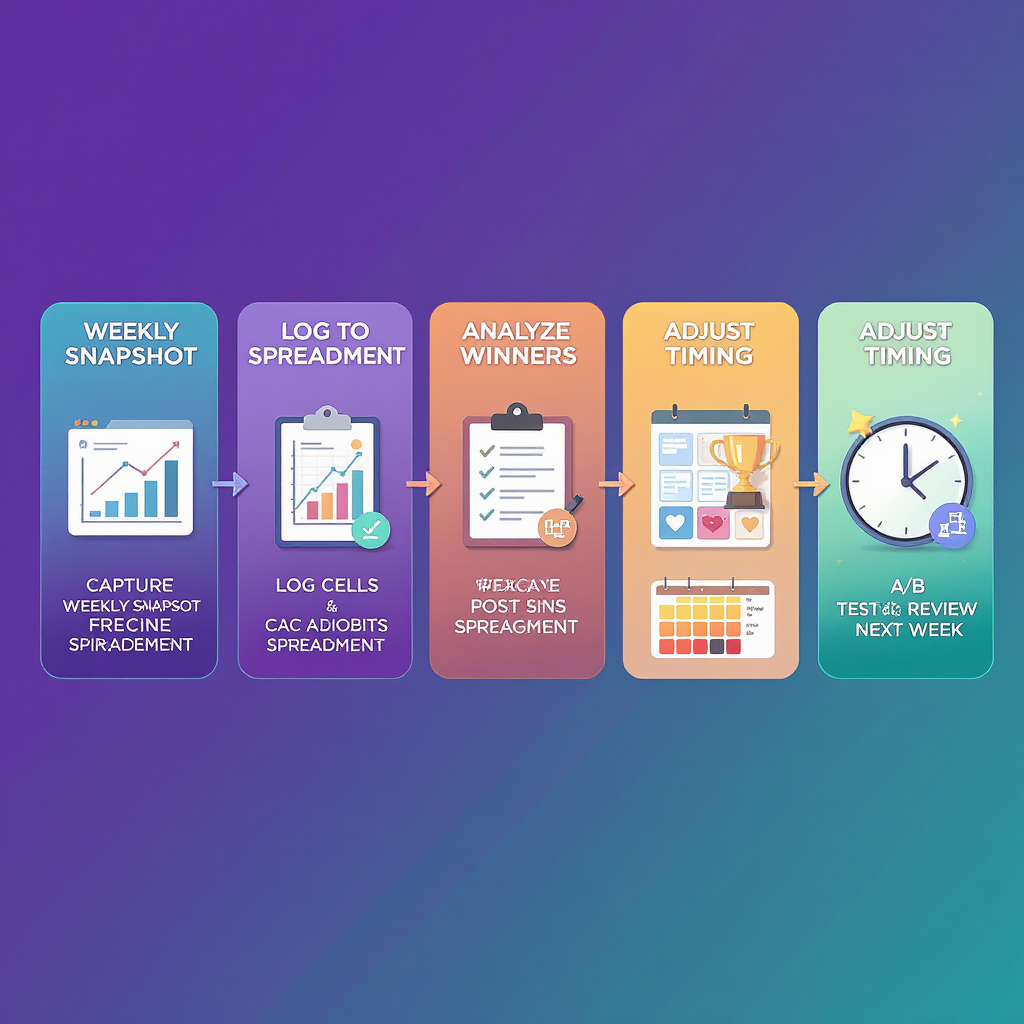
A zero-cost weekly workflow
You don’t need fancy dashboards. You need a habit.
- Set up a simple tracking sheet (Google Sheets or Notion)
- Columns: Date, Post URL, Post Type (text/image/video/thread), Topic/Tag, Impressions, Engagements, Engagement Rate, Link Clicks, CTR, Saves/Bookmarks (if you track), Notes.
- Add a “Goal” column (Awareness, Traffic, Follows, Leads) to tag intent.
- Each week, log your top posts
- Open “View post analytics” for your last 7 days.
- Enter the numbers for 3–10 posts that matter most.
- Annotate spikes
- Note what likely caused peaks: time of day, hook, visual, a mention, newsjacking, thread length, etc.
- Create a rolling 4-week snapshot
- Add a small summary area:
Last 4 Weeks Avg Engagement Rate =AVERAGE(TAKE(FILTER(G:G, A:A>=TODAY()-28), 10))
Last 4 Weeks Avg CTR =AVERAGE(FILTER(H:H, A:A>=TODAY()-28))
New Followers (28d) =MAX(FILTER(F:F, A:A>=TODAY()-28)) - MIN(FILTER(F:F, A:A>=TODAY()-28))- Keep it scannable: 3–5 metrics, 3 bullet insights, 2 actions.
- Rinse and improve
- Each week, write two hypotheses to test next week (e.g., “Question hooks lift CTR by 20%”).
---
Measure off-platform impact for free (UTMs + GA4)
Even the best on-platform metrics don’t tell you what happens on your site. Use UTM parameters and GA4 to connect the dots.
Build tagged URLs
Add UTM parameters to links you post on X:
https://example.com/landing-page
  ?utm_source=twitter
  &utm_medium=social
  &utm_campaign=sept_launch
&utm_content=hook_variant_a- utm_source: twitter (or x)
- utm_medium: social
- utm_campaign: a project or theme
- utm_content: variant (post ID, creative, or hook)
Pro tip: Keep a small UTM builder tab in your sheet.
Read GA4 reports
- GA4 > Reports > Acquisition > Traffic acquisition
- Filter Session source = twitter or x (depending on your UTM).
- Compare CTR-like behavior with “Engaged sessions,” “Views,” “Conversions.”
- GA4 > Reports > Engagement > Landing page
- See which pages receive X traffic and how they convert (events/goals).
Reconciling on- vs off-platform:
- If link clicks are high but GA4 sessions are low, check:
- UTM accuracy and final URL redirects.
- Mobile in-app browser behavior and consent prompts.
- Bot filtering and session thresholds.

---
Freemium tools that can help (verify current plan limits)
These can complement your twitter analytics free setup. Always check live plan pages for updates.
| Tool | Free tier highlights | Use it for | Caveats |
|---|---|---|---|
| Metricool | Basic analytics for 1 brand on free plan (as of writing) | Scheduling + simple performance views | Historical depth and exports may be limited |
| Followerwonk | Limited follower/bio analysis | Find audience keywords, compare followers | Sampling; rate/usage limits apply |
| SocialBlade | Public follower trend charts | Quick competitor follower trajectory | Lag and gaps for smaller accounts |
Use responsibly: Stick to public data, abide by terms, and avoid scraping private information.
---
Find winning topics and hashtags without paying
You don’t need an expensive “listening” suite to get 80% of the insight.
- Advanced search operators
(from:YourHandle) (link OR filter:links) -is:reply
("your keyword" OR #YourTag) lang:en min_faves:50 -is:retweet
("problem you solve") until:2025-09-01 since:2025-06-01
(yourbrand OR productname) (review OR “first impressions”) -is:retweet- Lists for niche conversations
- Create public or private Lists of customers, partners, industry reporters, or power users. Scan daily to spot patterns.
- Bookmarks as a swipe file
- Save posts with high engagement and similar audience. Tag them in a Notion gallery or add notes in your sheet.
- Lightweight content testing
- Test 2 hooks on different days but identical creative.
- Alternate thumbnail styles for video posts for 2 weeks.
- Try two CTAs and compare CTR and profile visits.
---
Competitor benchmarking using public data
You can’t see competitors’ impressions, but you can estimate relative performance with public interactions.
- Build a peer set
- 5–10 accounts with similar audience size and content scope.
- Collect a sample
- For each competitor, log last 10–20 posts: likes, reposts, replies, quotes, post date/time, follower count (at logging time).
- Compute a public engagement rate proxy
Public ER per post = (Likes + Reposts + Replies + Quotes) / Followers- This normalizes by audience size. It’s imperfect (impressions differ), but good for ballpark comparisons.
- Compare medians, not single spikes
- Use median ER across the sample to avoid outliers dominating.
- Extract targets
- If your median ER is 0.6% and the peer median is 1.0%, aim to close the gap with 2–3 concrete tests.
---
Dashboards without the API
You can still deliver a clean one-page monthly report for stakeholders.
What to include (1 pager):
- Summary KPIs (last month vs prior): Impressions, Avg Engagement Rate, Link Clicks, CTR, New Followers, Sessions/Conversions from X.
- Top 3 Posts: Thumbnail, hook text, key metrics, takeaway (what to replicate).
- Traffic & Conversions: GA4 sessions and conversion events attributed to utm_source=twitter.
- Insights & Actions: 3 bullets of what worked, 3 bullets of what to do next.
How to build it:
- Use your sheet’s 28–30 day filters for averages and totals.
- Paste 2–3 screenshots:
- Per-post analytics (best post)
- GA4 landing page table filtered for twitter/x
- Follower trend (from SocialBlade or your manual log)
- Keep links to raw data at the bottom for transparency.

---
When free isn’t enough
Signs it’s time to upgrade:
- You spend >2 hours/week copy-pasting numbers.
- You need automated, client-ready reports and scheduled exports.
- You require audience demographics, content labeling, or topic clustering.
- You need longer historical archives for seasonality analysis.
- Your team needs shared dashboards and governance.
Must-have features in paid tools:
- Reliable data capture with backfill/history.
- Post-level exports, UTM validation, and GA4 integration.
- Tagging/taxonomy for content (themes, formats, campaigns).
- Competitor tracking with clear methodology and sampling notes.
- Alerts (post spikes, follower anomalies) and basic forecasting.
Privacy and compliance best practices:
- Respect platform terms; avoid scraping private data or circumventing rate limits.
- Use UTMs transparently; ensure cookie consent and clear privacy notices on your site.
- Minimize personally identifiable information in your sheets; restrict access.
- Document your measurement plan (what you track, why, and for how long).
---
The free path to better X performance
You don’t need a budget to get smarter. With twitter analytics free workflows—per-post analytics, a lean spreadsheet, UTMs, GA4, and a couple of freemium tools—you can identify what works, learn faster than your competitors, and turn those learnings into growth.
Start this week: set up the sheet, log your last 10 posts, tag your top 3, and write two hypotheses to test. In 30 days, your content—and your results—will look very different.
---
Summary
You can build a powerful, zero-cost analytics system for X by combining native per-post insights, a lightweight spreadsheet, and UTMs connected to GA4. Track only the metrics that map to outcomes, review them weekly, and turn patterns into tests. As your needs grow, you’ll know exactly when and why to upgrade to paid tooling.


