Create and Use a Twitter Dashboard for Analytics Insights
Learn how to create a Twitter analytics dashboard, track key metrics like engagement rate and CTR, and visualize data with free tools like Google Data Studio.
Introduction to a Twitter Dashboard and Its Benefits
A Twitter dashboard is a centralized analytics hub that helps marketers, businesses, and social media professionals track, visualize, and act on data from their Twitter accounts. Using a dashboard, you can consolidate all your key metrics in one place, saving you time, eliminating manual tracking, and providing clear insights to improve your content strategy. These dashboards turn scattered numbers into a coherent story about audience engagement, growth, and performance — making them a vital part of a modern social media toolkit.
---
Understanding the Twitter Dashboard
A Twitter dashboard is an organized digital interface that consolidates your Twitter data into one place. It allows marketers, businesses, and social media professionals to monitor performance, track engagement, and make informed decisions without hopping between multiple analytics views.
Instead of manually compiling numbers from scattered sources, a dashboard centralizes your metrics into easy-to-read charts, graphs, and tables — helping you connect the dots between content, audience, and outcomes.

For marketers, a Twitter dashboard matters because:
- Data-Driven Decisions: Adjust campaigns based on actionable insights.
- Time-Saving: Avoid repetitive manual data collection.
- Clarity: Visualizing key metrics helps identify patterns and anomalies.
- Collaboration: Teams can work from the same data source for consistent reporting.
---
Essential Metrics to Track on a Twitter Dashboard
When building a Twitter dashboard, focus on data that can guide your strategy. Four essential KPIs to include are:
- Engagement Rate
- The proportion of users interacting (likes, retweets, replies) with your tweets compared to total impressions.
- Impressions
- The number of times your tweets were displayed on timelines, in search results, or on your profile.
- Followers Growth
- The net number of new followers in a given period — a signal of audience expansion.
- Click-Through Rate (CTR)
- How often people click links in your tweets, indicating content relevance and call-to-action effectiveness.
---
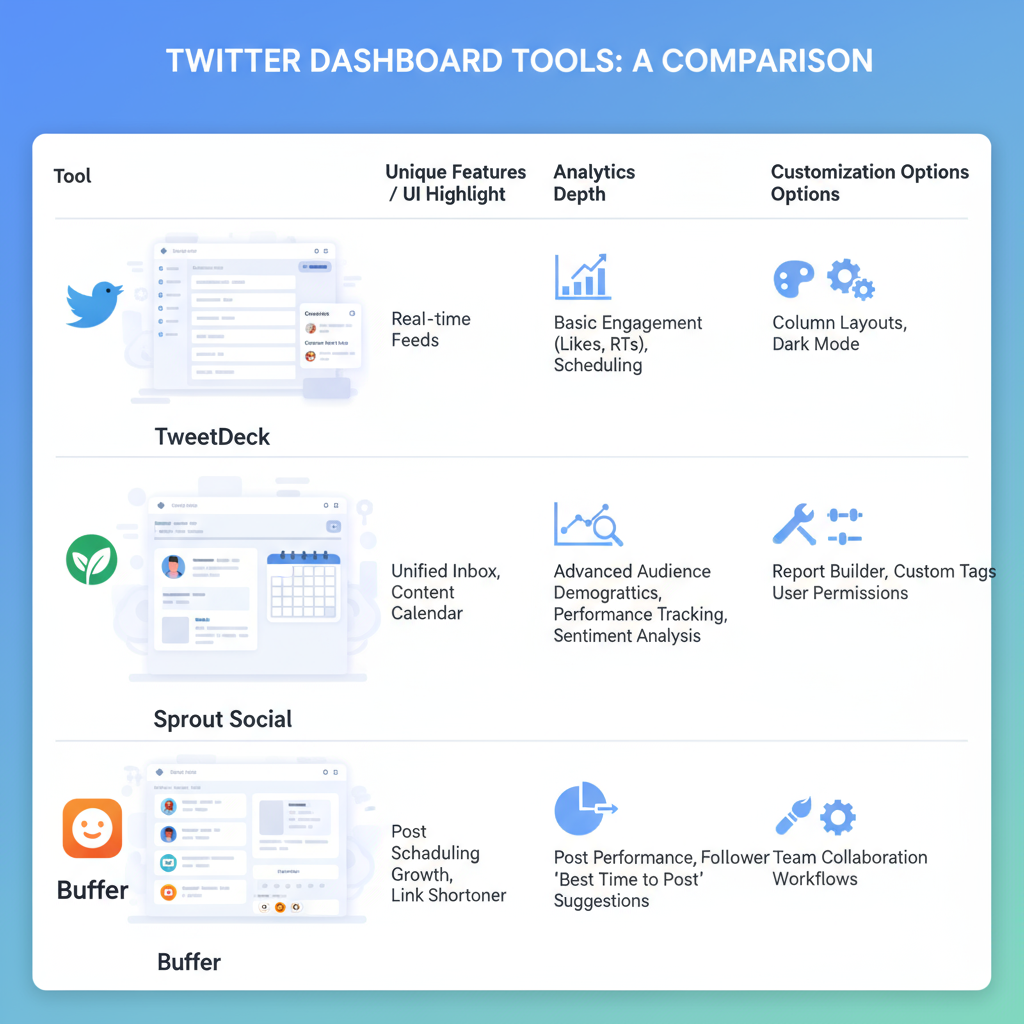
Comparing Popular Twitter Dashboard Tools
Different tools provide different strengths. Here’s a comparison of the most commonly used options:
| Tool | Key Features | Best For | Pricing Model |
|---|---|---|---|
| Twitter Analytics (Native) | Free data on impressions, engagement, followers, tweet activity | Basic user insights | Free |
| Hootsuite | Scheduling, multi-platform monitoring, custom reports | Agencies, large teams | Subscription |
| Sprout Social | Advanced analytics, CRM features, keyword tracking | Data-driven marketers | Subscription |
| TweetDeck | Real-time monitoring, multi-account capability | Community managers | Free |
| Google Data Studio | Custom visualizations, integrates with APIs | Analysts, custom dashboard builders | Free |
---
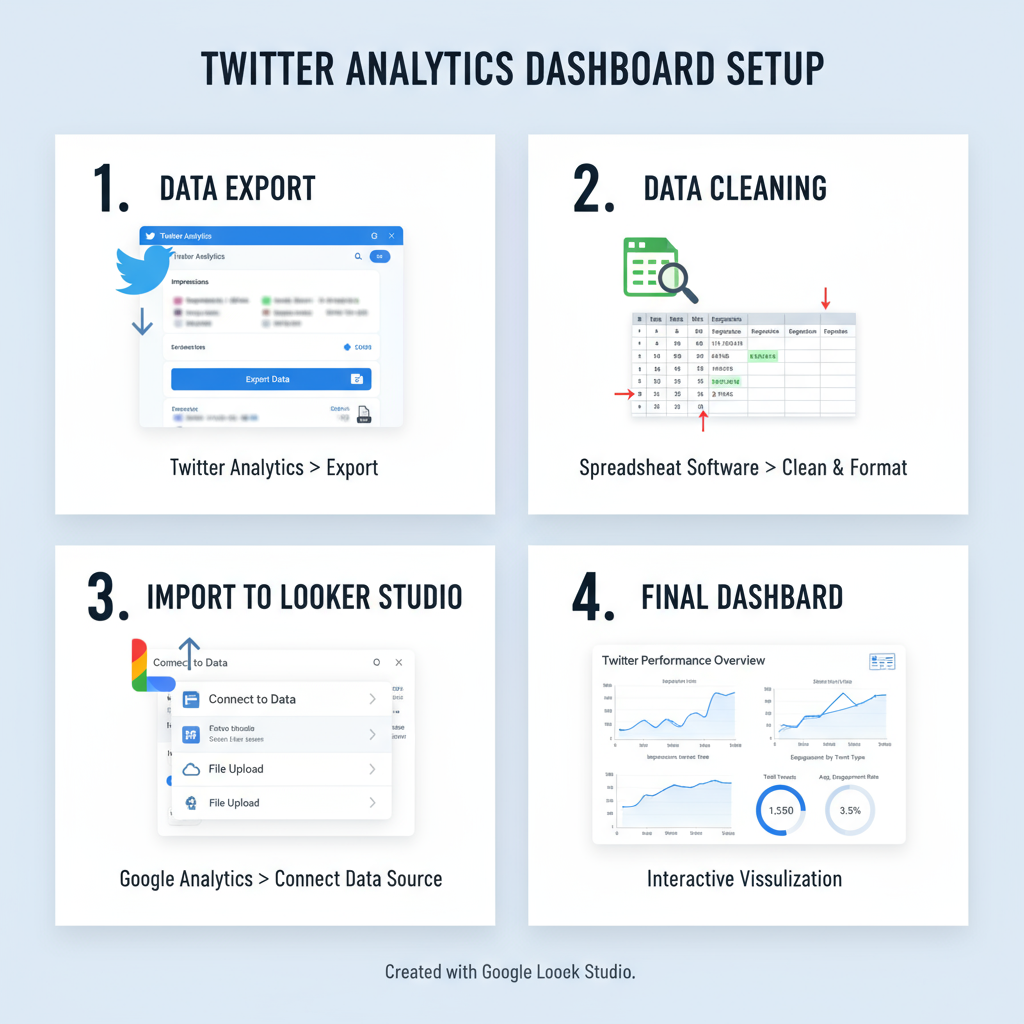
Step-by-Step: Setting Up a Basic Twitter Dashboard (Free Tools)
Here’s a simple process using Twitter Analytics and Google Data Studio (Looker Studio):
1. Access Your Data
- Log into analytics.twitter.com
- Download CSV reports for your target date range.
2. Prepare the Data
- Clean columns in Excel or Google Sheets.
- Keep metrics like Date, Impressions, Engagements, CTR, Followers.
3. Import to Google Data Studio
- Open Google Data Studio.
- Connect to your Google Sheet.
- Use charts and scorecards for visual representation.
4. Customize Layout
- Add branding colors and logos.
- Group metrics by category: Audience, Engagement, Content performance.
5. Share and Automate
- Set up automated email delivery for periodic reports.
---
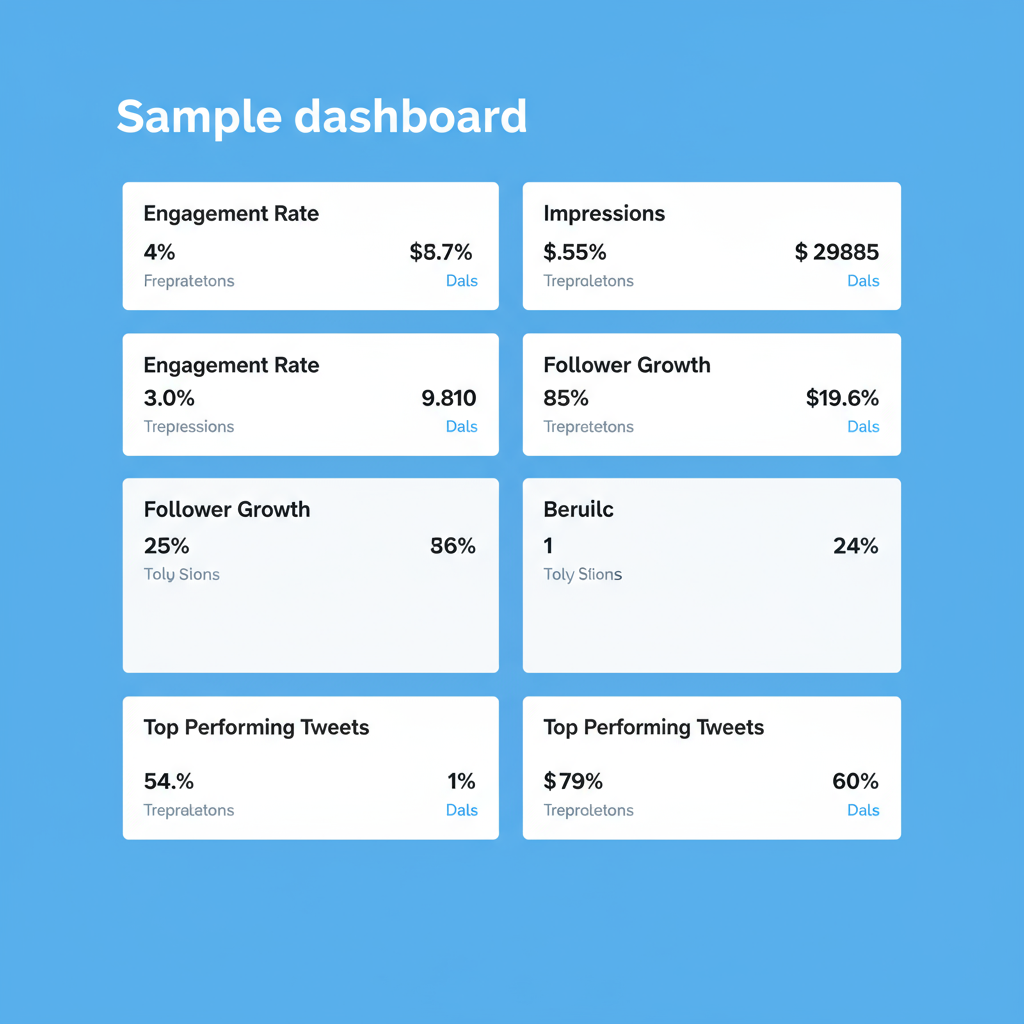
Segmenting and Visualizing Data for Actionable Insights
Segmentation lets you break down data into meaningful subsets:
- By Content Type: Links, images, videos, threads.
- By Time of Day: Compare morning vs. evening performance.
- By Audience Segment: Region, device type.
Visualization ideas for your Twitter dashboard:
- Line Graphs for follower growth or impressions over time.
- Bar Charts for comparing content formats.
- Tables for top-performing tweets with engagement details.
---
Interpreting Analytics Data to Improve Content Strategy
Analyzing your Twitter dashboard is only valuable if you act on the findings. For example:
- High CTR, Low Impressions: Messaging works, but reach is limited — consider promotion or hashtags.
- High Impressions, Low Engagement: Adjust visuals, copywriting, or calls-to-action.
- Follower Drops: Audit recent content for relevance and tone.
Action Step: Run A/B tests for post formats to uncover top performers.
---
Integrating Multiple Social Profiles into One Dashboard
For multiple accounts or platforms, integration is essential:
- Hootsuite & Sprout Social: Integrate profiles and cross-platform data.
- Google Data Studio: Merge Twitter, Facebook, Instagram data with connectors.
A unified dashboard improves efficiency, spots cross-platform patterns, and streamlines reporting.
---
Automating Reporting and Scheduling
Automation ensures regular monitoring without extra effort:
- Data Refresh: Connect live API feeds in Google Data Studio for auto-updates.
- Email Scheduling: Share dashboards weekly or monthly.
- Post Scheduling: Align TweetDeck or Buffer publishing with analytics reviews.
---
Common Mistakes to Avoid
- Tracking Too Many Metrics: Focus on relevant KPIs.
- Ignoring Context: External events can impact performance.
- Not Acting on Insights: Data only matters when applied.
- Neglecting Historical Comparison: Compare periods to gauge real changes.
---
Future Trends in Twitter Analytics and Dashboards
Upcoming developments may include:
- AI-Powered Insights: Automated posting recommendations.
- Advanced Sentiment Analysis: Gauge emotional tone in replies.
- Voice and Video Analytics: Deep dive into multimedia.
- Cross-Network Benchmarking: Competitor comparison automation.
As Twitter evolves into X, dashboard features will adapt, offering sharper and more predictive insights.
---
Summary and Next Steps
A tailored Twitter dashboard can transform raw data into a strategic advantage. By starting with free tools like Twitter Analytics and Google Data Studio, you can build a foundation that scales with your needs. Focus on meaningful KPIs, visualize for clarity, and take actionable steps from your analytics.
Ready to elevate your social media game? Start building your Twitter dashboard today to track performance, optimize content, and grow your audience with confidence.