Average Twitter Engagement Rate Benchmarks and Tips
Learn Twitter engagement rate averages by industry, how to calculate them, and proven tactics to boost audience interaction and content performance.
Introduction to Twitter Engagement Rate Average
The Twitter engagement rate average is a key metric that social media marketers use to evaluate how well their tweets resonate with audiences. This figure, expressed as a percentage, measures the level of interaction—likes, retweets, replies, clicks, and views—relative to the number of times your tweets are seen. Understanding and improving this number helps you boost reach, foster loyal followers, and enhance brand presence on the platform.

In this guide, we’ll break down the components, calculation methods, benchmarks, and actionable tactics for increasing your engagement rate above the industry average. Whether you manage a small niche account or a global brand profile, these insights will help you refine your Twitter strategy.
---
Understanding Twitter Engagement Rate
Twitter engagement rate reflects how actively your followers and viewers interact with your content. This includes:
- Liking your tweets to show approval.
- Retweeting to spread your message.
- Replying to foster conversation.
- Clicking links or media to explore more.
- Viewing embedded videos or images.
A high engagement rate indicates your audience finds the content meaningful, relatable, or entertaining—making it one of the most important metrics to track in Twitter marketing.
---
Components of Twitter Engagement
Twitter categorizes various user actions as engagements:
- Likes – Quick approval or enjoyment signal.
- Retweets – Amplification of reach by followers.
- Replies – Direct interaction that builds community.
- Link Clicks – Brings traffic to your website or other online properties.
- Media Views – Visual or multimedia consumption.
Understanding these categories makes it easier to optimize content toward the types of engagement that matter most to your goals.
---
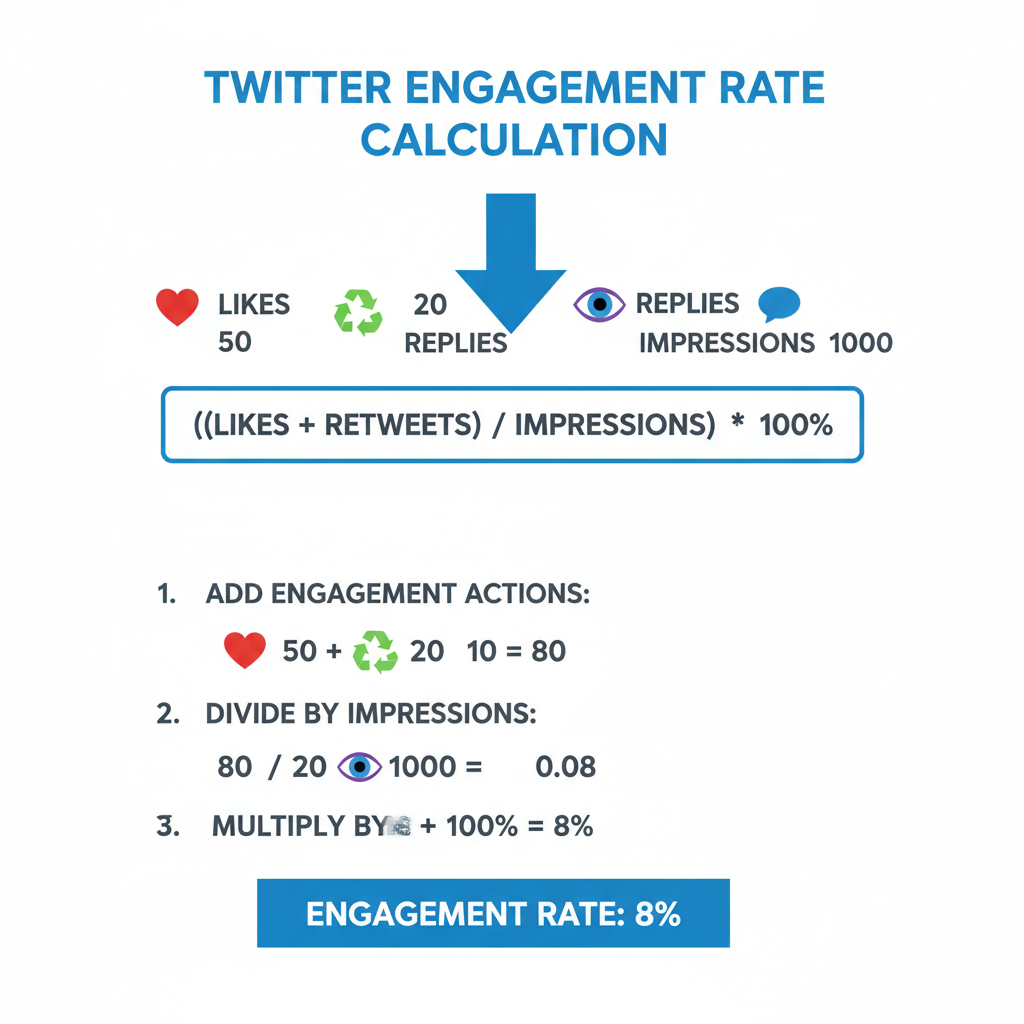
How to Calculate Twitter Engagement Rate
The formula is simple:
Engagement Rate (%) = (Total Engagements / Total Impressions) × 100Definitions:
- Total Engagements = Likes + Retweets + Replies + Link Clicks + Media Views
- Total Impressions = Number of times the tweet was displayed.
Example:
A tweet receives:
- 20 likes
- 5 retweets
- 3 replies
- 7 link clicks
Total engagements = 35
Impressions = 1,000
Engagement Rate = (35 / 1000) × 100 = 3.5%This rate is a snapshot of tweet performance and can serve as a benchmark for future posts.
---
Average Twitter Engagement Rate Benchmarks
Industry benchmarks help you compare performance. Twitter’s fast-paced feed means average rates are generally lower than for visual-first platforms.
| Industry | Average Engagement Rate |
|---|---|
| Global Overall | 0.045% - 0.15% |
| Technology | 0.07% - 0.12% |
| Media/News | 0.12% - 0.18% |
| Retail | 0.05% - 0.09% |
| Non-profit | 0.1% - 0.2% |
| Sports | 0.15% - 0.25% |
If your rate exceeds these numbers, you are outperforming your industry peers.
---
Key Factors Influencing Engagement Rate
Your engagement rate can fluctuate due to:
- Content Format: Tweets with visuals, videos, or polls are often more compelling.
- Frequency: Posting too often can fatigue followers; too rarely can reduce relevance.
- Audience Size: Larger accounts may see lower rates due to broader, less targeted audiences.
- Topic Relevance: Addressing trending or timely subjects tends to draw more interaction.
---
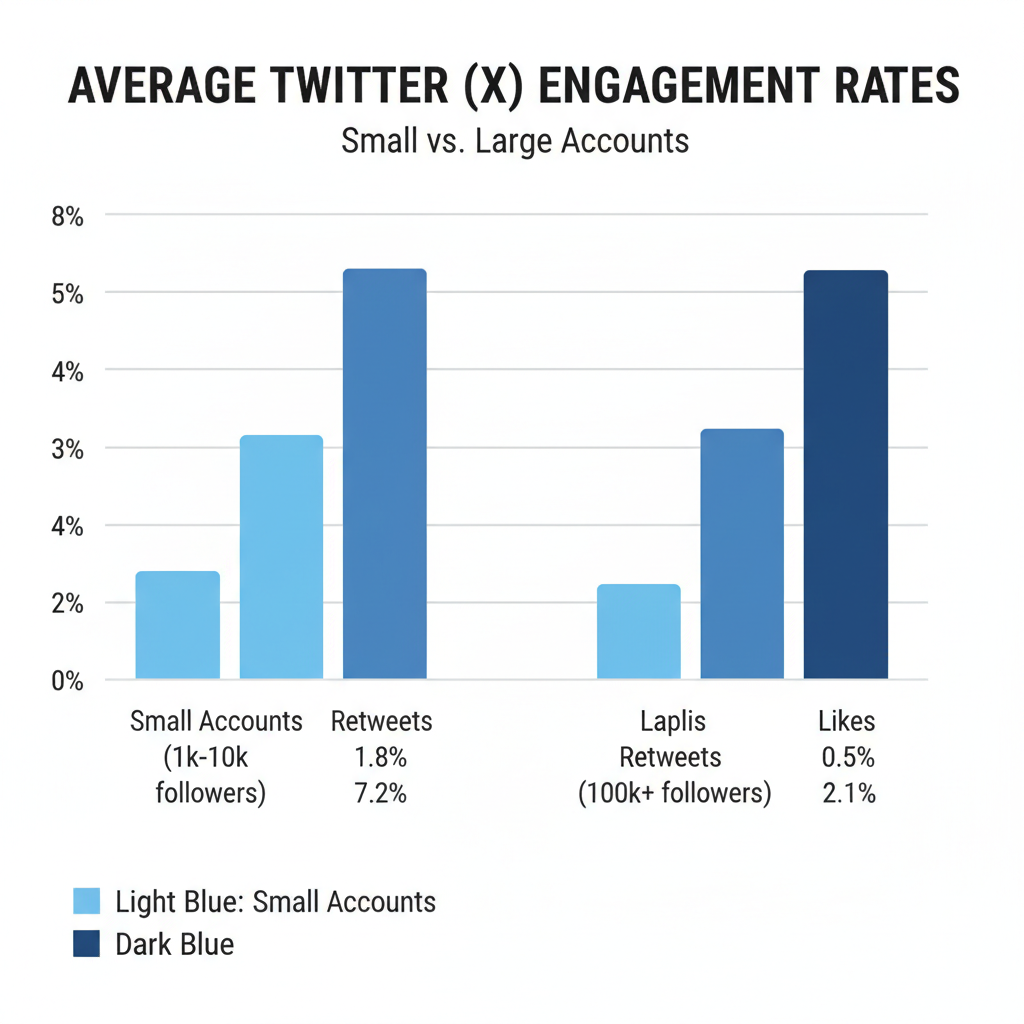
Small vs. Large Accounts: Engagement Comparison
Follower volume significantly impacts percentage engagement rates.
| Follower Count | Typical Engagement Rate |
|---|---|
| Under 1,000 | 1% - 3% |
| 1,000 - 10,000 | 0.5% - 1.5% |
| 10,000 - 100,000 | 0.2% - 0.8% |
| 100,000+ | 0.05% - 0.3% |
Smaller accounts enjoy higher engagement percentages thanks to tighter community bonds.
---
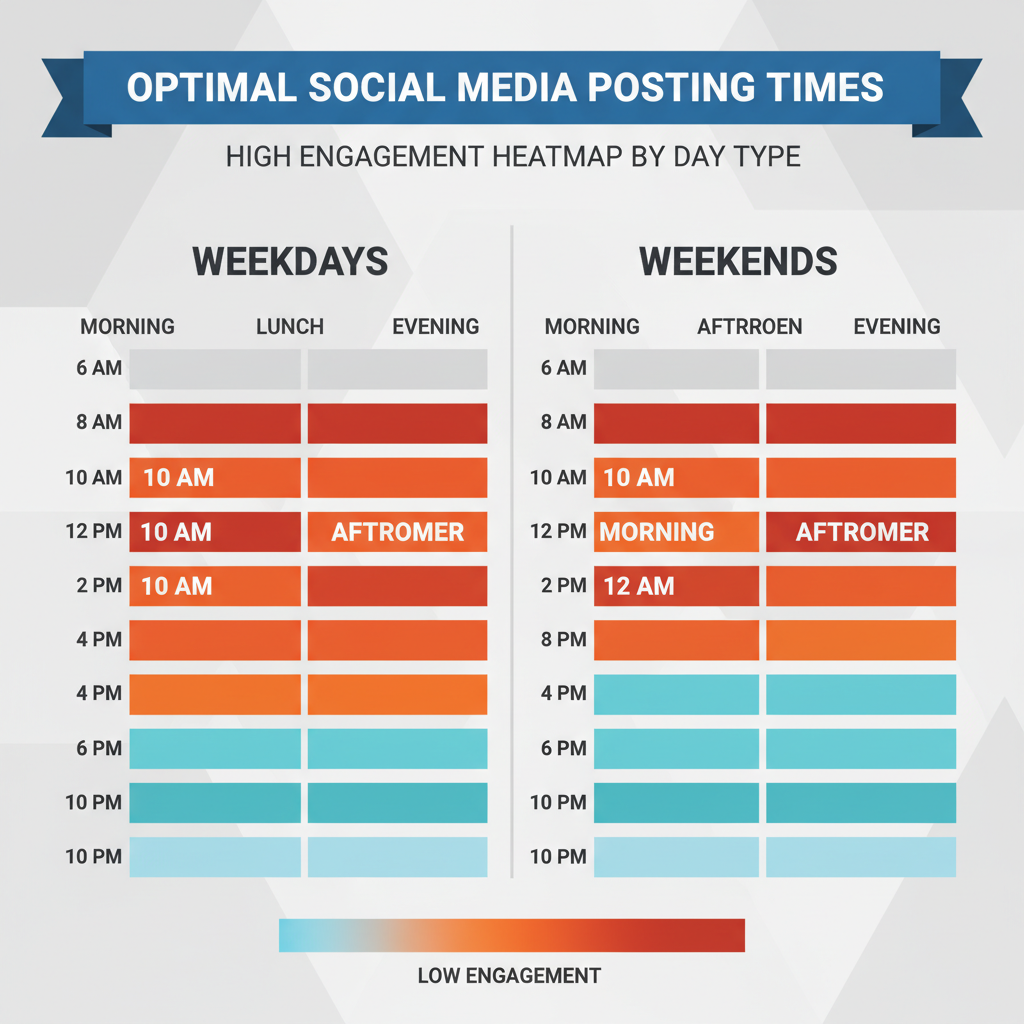
Best Posting Times for Engagement
Engagement varies by time of day:
- Morning (8–10 AM): Ideal for industry news.
- Midday (12–1 PM): Great for office audiences.
- Evening (7–9 PM): High entertainment consumption.
Test multiple time slots, review analytics, and tailor schedules to your specific audience.
---
Content Strategies to Boost Engagement
Tactics proven to elevate engagement:
- Polls: Spur participation with questions.
- Visual Content: Make tweets attention-worthy.
- Threads: Deconstruct topics into easy-to-digest segments.
- Mentions: Include influencers or customers to encourage response.
Combine these strategies for varied, interactive content.
---
Hashtag Best Practices
Use hashtags wisely to enhance discoverability without appearing spammy:
- Keep to 1–3 relevant hashtags.
- Align with trending tags where appropriate.
- Create and promote branded hashtags for ongoing campaigns.
---
Responding to Comments and Messages
Engagement is a two-way street—actively reply to mentions and direct messages to:
- Strengthen follower loyalty.
- Demonstrate attentiveness.
- Encourage growth via recommendations.
---
Tracking and Optimizing Engagement
Leverage Twitter Analytics to monitor:
- Engagement rates per post.
- Trends over weeks/months.
- Audience demographics.
Identify what works, replicate successes, and refine underperforming content.
---
Case Study: 3-Month Engagement Growth
A mid-sized tech company (~8,000 followers) targeted increasing its engagement rate from 0.6% to 1.2%.
Strategy:
- Weekly thematic threads.
- Two polls per week.
- Visual content for product launches.
- Reply to every comment within two hours.
Outcome:
- Achieved 1.3% engagement rate.
- 25% more daily impressions.
- 12% follower growth.
Consistent, interactive content proved to be the driver of success.
---
Common Engagement Rate Pitfalls
Avoid:
- Exclusively promotional tweets.
- Ignoring replies or mentions.
- Overloading hashtags.
- Omitting visuals.
---
Actionable Checklist to Surpass Twitter Engagement Rate Average
- Calculate engagement rate weekly.
- Post at peak audience times.
- Use polls, visuals, and threads.
- Include 1–3 targeted hashtags.
- Promptly respond to comments/DMs.
- Review analytics regularly.
- Add value beyond promotion.
- Experiment with new formats monthly.
---
Summary and Next Steps
By knowing your Twitter engagement rate average, comparing it with industry benchmarks, and using proven strategies, you can steadily increase audience interaction and brand visibility. Regular analysis and responsive communication form the backbone of sustained improvement.
Ready to boost your numbers? Apply the checklist above, track your progress weekly, and watch your engagement climb above the norm.