Twitter Impressions: What They Are, How They Work on X, and How to Grow Them
Learn what Twitter/X impressions are, how they differ from views, where to find them in Analytics, what counts, and practical ways to grow them without spam.

Twitter Impressions: What They Are, How They Work on X, and How to Grow Them
Twitter impressions (now on X) are one of the most visible metrics creators and brands watch. Yet they’re also one of the most misunderstood. This guide demystifies impressions: what they are, where to find them, what affects them, and the practical ways to lift your numbers without resorting to spammy tactics.
What “Twitter impressions” actually are
In X Analytics, an impression is counted each time your post is rendered on-screen for a user on X. Think “times shown,” not “unique people.”
Contrast impressions with related metrics so you don’t optimize for the wrong thing:
- Reach: An estimate of unique accounts exposed. X doesn’t publicly show “reach” for organic posts in the same way many other platforms do. Impressions can be larger than reach because repeated exposures to the same person count multiple times.
- Profile visits: Clicks into your profile from your post or username mention. This is downstream activity, not exposure.
- Video views: Tracked separately with their own view-thresholds and autoplay rules. A post can have high impressions but low video views if the video doesn’t hook attention quickly.
- Engagements: Total interactions (likes, replies, reposts/retweets, quotes, bookmarks, link clicks, detail expands). Engagements are a subset of impressions.
A helpful mental model
- Impressions = distribution
- Engagements = resonance
- Conversions (e.g., sign-ups) = business impact
Impressions vs the public “Views” counter
X displays a public “views” counter on posts and a separate “Impressions” number in Analytics. They often correlate but may not match exactly. Reasons include anti-spam filtering, logged-out web traffic, off-platform surfaces, and data latency. For decision-making, rely on Analytics “Impressions” for consistency.
Where to find impressions in X Analytics
You can view impressions at both the post and account levels.
Post-level
- Web/mobile: Open any post you authored, tap “View post analytics.” You’ll see Impressions, Engagements, Detail expands, Link clicks, etc.
- Date: Post-level stats accumulate from publish time onward and update over time.
Account-level
- Creator/Professional dashboards: From your profile on web, go to Professional Tools or Creator Tools, then Analytics. You can filter by date ranges (e.g., last 7 days, 28 days, custom).
- Exports: Periodically export or snapshot metrics to watch trends across weeks and months.
How X counts an exposure
- Registered when your post is actually rendered in a user’s viewport (on screen), not simply loaded below the fold.
- The same user can generate multiple impressions if they encounter your post multiple times (e.g., Home and Search).
- Data may lag slightly; expect day-over-day adjustments.
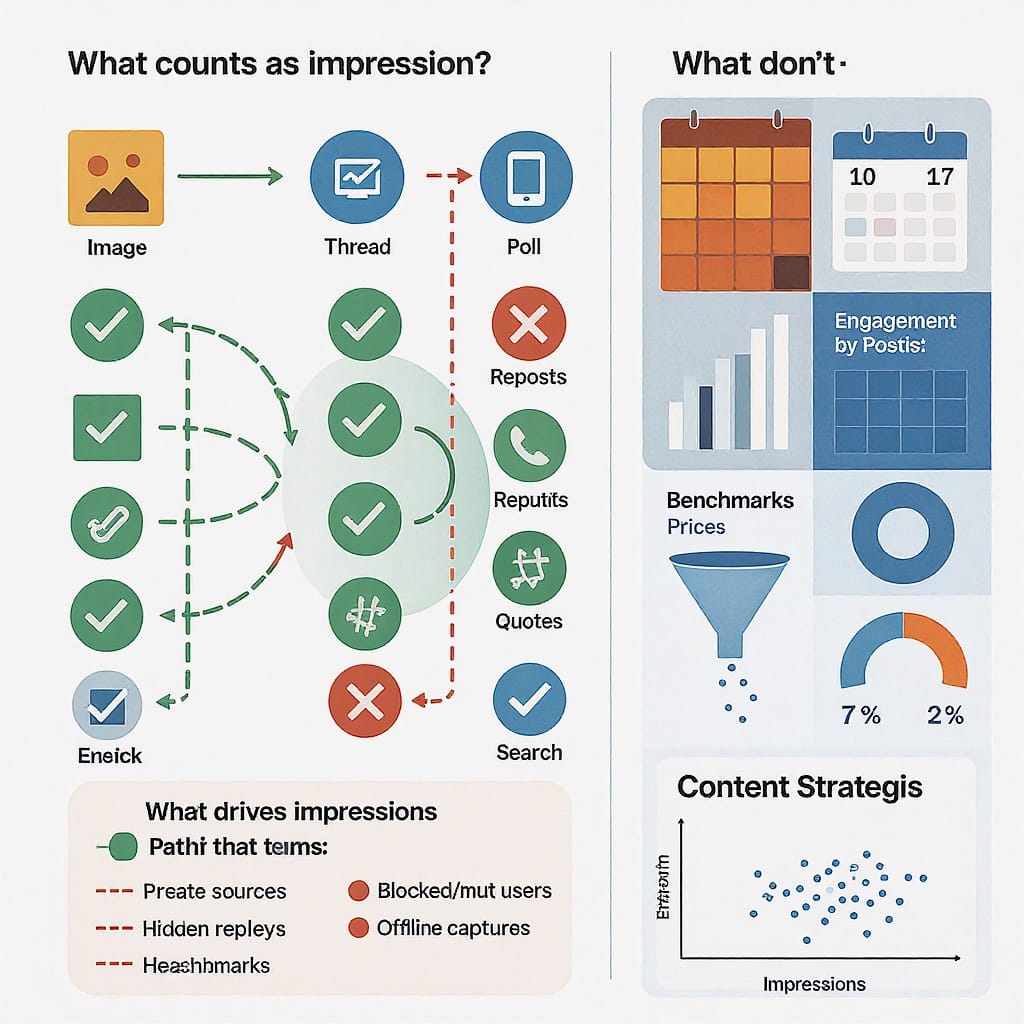
What counts and what doesn’t
To avoid confusion, here’s what typically contributes to impressions.
Counts toward impressions
- Home timeline (For You and Following tabs)
- Lists and Communities feeds
- Search results and Trends modules
- Your profile timeline
- Tweet detail pages (when someone opens your post)
- Notifications feeds where your post is rendered (e.g., when someone is mentioned or follows you)
- Organic and paid delivery both contribute, but ads will also appear in Ads Manager reporting
Usually does not count in native Analytics “Impressions”
- Off-platform embedded posts on third-party sites (these may be tracked differently and often don’t roll into the same Impressions total you see in Analytics)
- Screenshots and reposts on other networks
Special cases and caveats
- Logged-out users: Public web views by logged-out users and web crawlers are not reliably counted in Analytics Impressions. Expect undercounting if much of your audience is logged out or off-platform.
- Repeated exposures: If the same user sees your post multiple times on X, each valid on-screen render generally counts as an impression.
- Paid vs organic: Organic impressions show in Analytics. Paid campaigns add impressions in both Analytics and Ads Manager; Ads Manager will provide more granular delivery diagnostics (frequency, placements).
What drives impressions on X
The distribution system prioritizes posts that are relevant and engaging for specific audiences at specific times. Key drivers include:
- Relevance signals:
- Language and topical alignment with a user’s interests
- Author affinity (how often a user interacts with or follows you)
- Keyword/semantic match to trending conversations
- Recency:
- Fresh posts typically get an initial trial window in feeds. Timely, breaking, or event-driven content benefits more.
- Engagement velocity and quality:
- Early likes, replies, and high-quality quotes from relevant accounts increase distribution potential.
- Quality matters: Replies that spark further conversation, not just low-effort spam, are stronger signals.
- Media type:
- Native images, carousels, and short native videos often win more feed trial than text-only posts, assuming they’re relevant and fast-loading.
- Polls can increase touches and time-on-post, which may help overall distribution.
- Topicality:
- Current events, seasonal themes, and live moments (sports, product launches, conferences) receive preferential user attention.
- Follower graph effects:
- When your followers engage, their networks are more likely to see your post in For You.
- Collaborations that bridge graphs can unlock new distribution paths.
Benchmarks and context
Benchmarks vary wildly by niche, recency, and content type. Use them as directional—not absolute—targets.
| Account size | Impressions per post vs followers (typical) | Engagement rate per post (engagements / impressions) | Notes |
|---|---|---|---|
| < 5K followers | 10% – 100%+ | 2% – 6% | Small graphs can “punch up” via For You when content hits a timely niche. |
| 5K – 50K followers | 5% – 60% | 1.5% – 4% | More stable distribution; threads and native media help discovery. |
| 50K – 250K followers | 3% – 40% | 1% – 3% | Audience heterogeneity increases; tighter topical focus lifts averages. |
| 250K+ followers | 2% – 30% | 0.5% – 2% | Scale often reduces average rates; big spikes still happen on major moments. |
When low impressions aren’t a red flag
- Niche topics with smaller addressable audiences
- Posts that intentionally trade impressions for deeper clicks (e.g., long-form links)
- Off-hours posting for global audiences where you’re seeding content to support threads later
- Content aimed at a specific Community or List rather than broad For You distribution
Content strategies to lift impressions
Winning impressions starts with making your posts easier to trial and easier to understand.
- Start with a strong hook:
- Front-load value in the first 1–2 lines.
- Use “why” or “what changes” framing: “The 3 levers that doubled our sign-ups last week…”
- Visuals:
- Use native images or short native videos. Keep text readable on mobile.
- Add alt text for accessibility (also a relevance signal).
- Favor square or 16:9 that previews cleanly in timelines.
- Threads (mini-articles):
- Lead with the payoff; keep each tweet skimmable.
- Use continuity hooks (“Part 2: The counterintuitive step that saved us 40% time.”)
- Native video:
- Hook in the first 2–3 seconds with motion or a bold statement.
- Always add captions; many views are muted.
- Polls:
- Use to spark participation and gather lightweight insights.
- Follow with a thread that interprets results.
- Topical keywords (not keyword stuffing):
- Reference recognizable terms and entities people follow.
- Use natural phrasing; avoid looking like spam.
- Hashtags:
- Use sparingly and intentionally (often 0–2).
- Favor branded/event tags or highly relevant, active topics.
Distribution tactics beyond hitting “Post”
Even great content needs a nudge to find its audience.
- Replies as distribution:
- Add thoughtful, non-promotional replies under relevant large accounts or breaking-news threads. Avoid “link dropping.”
- Follow up on your own posts with value-add replies; it can extend the lifespan.
- Quotes vs retweets:
- Quotes can unlock For You distribution by adding new commentary.
- Retweets are best for quick boosts to your followers; mix both.
- Collaborations:
- Co-author threads, run joint Q&As, or exchange “hosted” replies.
- Tag collaborators in-context; ensure the content stands on its own without tags.
- Lists and Communities:
- Curate Lists in your niche; they’re distribution surfaces and research tools.
- Share to relevant Communities where allowed; match community norms.
- Spaces:
- Host or join live audio around timely topics. Share takeaways as a thread afterward to capture additional impressions.
- Cross-platform repurposing:
- Turn a carousel from LinkedIn into a thread; make a short clip from a podcast.
- When linking off-platform, provide substance in-post to earn distribution before the click.
Cadence and timing
Consistency beats bursts—without crossing into spam.
- Posting frequency:
- Many accounts see good results at 1–3 quality posts/day, plus selective replies.
- Scale up only if quality holds; low-quality volume can throttle distribution.
- Time-of-day and day-of-week:
- Start with your audience’s primary time zones (e.g., morning and early afternoon local time).
- Test weekends; some niches overperform with less competition.
- Scheduling:
- Use scheduling tools to stage posts at varied times, then analyze results.
- Leave room for real-time posts around news or events.
- Avoid spammy patterns:
- Don’t repeat the same post copy too frequently.
- Vary formats (single post, thread, image, video, poll).
- Space self-promotional links among value-first posts.
Measurement and experimentation
Treat impressions as an input metric—optimize them, but make sure they ladder up to meaningful outcomes.
- UTM tagging for external links:
- Use consistent campaign/source/medium to attribute traffic from X in your analytics.
- Example:
- A/B testing:
- Test hooks, thumbnails, and media types. Keep one variable per test.
- Run tests at similar times/days to reduce confounding.
https://example.com/landing?utm_source=x&utm_medium=social&utm_campaign=product_launch_q4&utm_content=hookA- Cohort tracking:
- Group posts by theme or format (e.g., “case_studies”, “how_tos”, “memes”) and compare impression and engagement medians per cohort.
- Lightweight dashboard:
- Weekly snapshot post-level metrics into a sheet: date, link, format, topic, impressions, engagements, video views, link clicks.
- Visualize 4-week rolling medians to spot drift.
- Avoid common pitfalls:
- Chasing impressions without engagement. Prioritize impression-to-engagement lift, not impressions alone.
- Misreading early performance: give posts time to accrue; some formats are slow-burn.
- Overreacting to one outlier. Use 3–4 week trend lines.
Troubleshooting drops in impressions
If your impressions suddenly dip, run this checklist.
Potential causes
- Policy/safety filters:
- Sensitive media flags, misinformation labels, or reply de-ranking can reduce distribution.
- Rate limits or behavioral flags:
- Excessive posting, repetitive content, or aggressive follow/unfollow behavior may dampen reach.
- Broken media or blocked links:
- Non-loading images/videos, slow pages, or domains flagged for spam/malware lose distribution.
- Audience churn:
- Loss of key engaged followers; topical fatigue; seasonality or holidays.
- Systemic changes:
- Algorithm or UX updates can rebalance traffic patterns temporarily.
Step-by-step recovery checklist
- Audit your last 10–20 posts:
- Note formats, topics, hooks, and whether there’s an overreliance on external links.
- Run a quality reset week:
- 1–2 high-effort posts/day, no repetitive promos, incorporate native media.
- Rebuild engagement velocity:
- Line up collaborators to reply/quote meaningfully at publish time.
- Fix technicals:
- Replace slow or blocked URLs, compress images/video, add captions and alt text.
- Rebalance topics:
- Emphasize your proven cohorts (e.g., “how_tos”), reduce underperforming themes.
- Time your posts:
- Publish at historically strong windows for your audience, then expand.
- Monitor Analytics daily:
- Look for a baseline stabilization over 7–10 days before scaling volume.
Final take
Impressions tell you how far your posts travel; engagement tells you what resonated; conversions tell you whether it mattered. Use all three. Create posts that earn their trial (clear hooks, native media, topical relevance), distribute them thoughtfully (replies, quotes, collaborations), and measure with rigor. When in doubt, tighten quality, align with live conversations, and let compounding consistency do its work.
Summary
Impressions on X measure on-screen renders, not unique people, and they’re influenced by relevance, recency, engagement quality, and media choice. Track them in X Analytics at both post and account levels, but optimize for impression-to-engagement lift and downstream outcomes. Consistent, high-quality content plus smart distribution and disciplined measurement is the sustainable path to growth.