Twitter Views (X): What Counts, How to Increase Them, and What They Actually Mean
Learn what X (Twitter) views actually count, how they differ from impressions and video views, where to find them, and ethical tactics to grow reach in 2025.

Twitter Views (X): What Counts, How to Increase Them, and What They Actually Mean
This practical guide demystifies how “views” on X are counted, where they appear, and how they differ from analytics impressions and video views. It also outlines the algorithm signals that drive distribution and provides ethical tactics to increase visibility without spam. Use it as a reference for measurement, testing, and day-to-day posting decisions.
If you’ve opened X (formerly Twitter) lately and wondered why one post has “42K views” while another shows very different numbers in Analytics, you’re not alone. In 2025, terminology has shifted, interfaces have moved, and APIs have tightened—but the core of how twitter views work (and how to grow them) is stable and learnable. This guide explains what “views” actually are, where to find them, what the algorithm rewards, and how to raise your reach without spammy tactics.
---
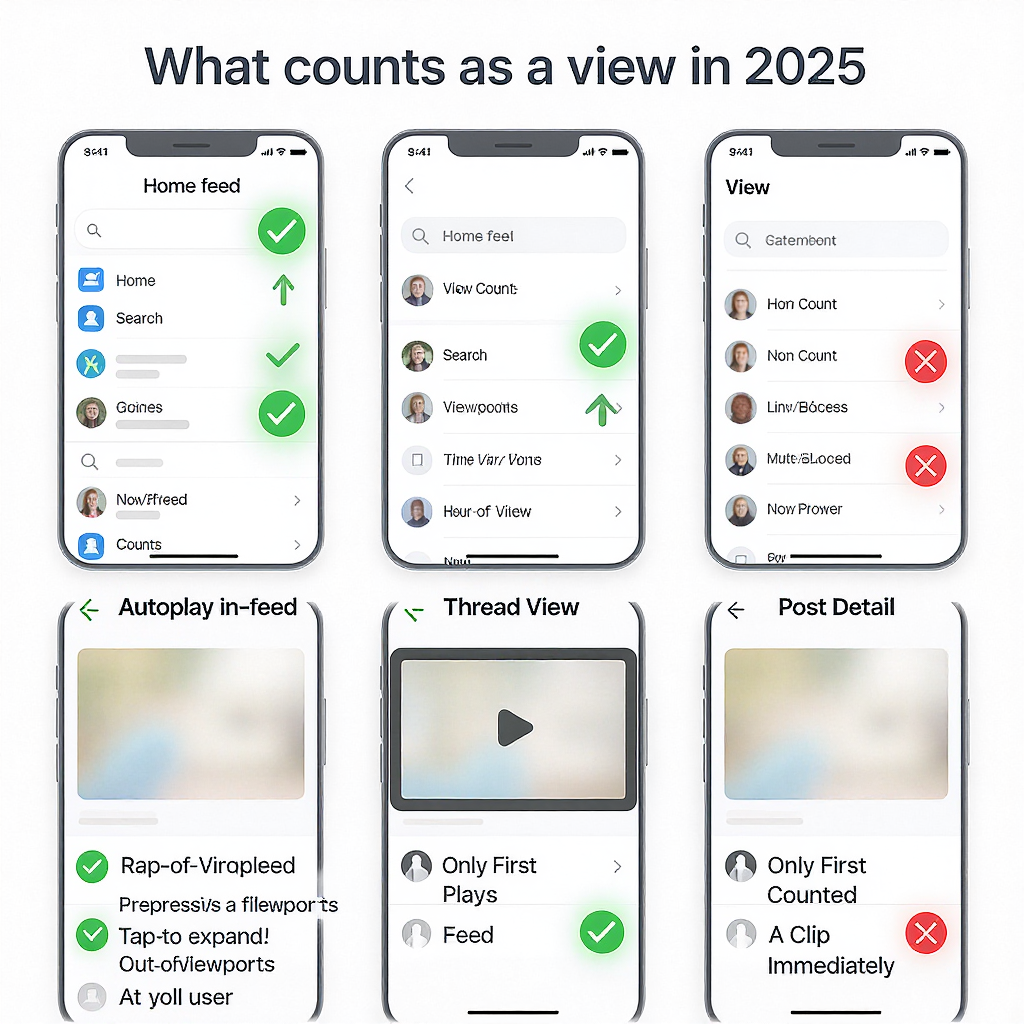
What “Twitter views” means in 2025
X now exposes multiple counters and terms that can be confusing at first glance:
- Public “Views” on a post: A counter shown on tweets in the feed and on the permalink.
- Impressions in Analytics: The legacy term for counted deliveries of a post to users, visible in per-post analytics and account-level dashboards.
- Reach (informal): Often used by marketers to mean “unique people who saw it.” X does not publish a de-duplicated “unique reach” number for all posts.
- Video views: A separate counter and analytics panel for video playback events that meet specific thresholds.
Why terminology changed but the metrics still matter:
- The public view counter was added to make tweet distribution more transparent to users beyond likes/replies/retweets.
- Advertisers and creators still optimize to impressions and engagement rates; those haven’t gone away, they’ve just moved behind analytics panels.
- For decision-making, think of “Views” as front-of-house visibility and “Impressions” as the backend accounting you use to measure performance over time.
---
How a view is counted on X
X does not publish a fully exhaustive technical spec, but these are the broadly observed rules as of 2025.
Eligibility scenarios for a tweet view:
- Home timeline and For You: When the tweet is rendered on screen for a user.
- Following tab: Same as above; in-feed render generally counts.
- Profiles: Opening a profile and having the tweet render in the list typically counts.
- Search and Trends: Rendering in search results or trend modules generally counts.
- Quote tweets: When someone views a quote tweet that embeds the original, the original typically accrues a view.
- Retweets: Views of a retweet accrue a view to the original.
- Embedded tweets off-platform: Embeds on websites can add to the public view counter when rendered.
- Logged-in vs logged-out: Analytics impressions are primarily for logged-in delivery; public view counts may include some logged-out and embed renders.
What differs between the public “View” counter and Analytics “Impressions”:
- Scope: Analytics impressions are focused on logged-in deliveries on X surfaces; public “Views” are reported to include additional contexts like embeds and potentially logged-out users.
- Timing and filters: Analytics filters out some non-human or very short non-viewable deliveries; the public counter is a simplified tally surfaced in real time.
- Deduplication: Neither metric is “unique reach.” Multiple exposures to the same person over time can increase both counts.
- Your own views: Analytics excludes your own account from impression counts. The public counter’s handling of author self-views is not consistently documented; treat public views as approximate.
Common misreadings to avoid:
- “Views = people”: Not true. They’re exposures, not unique humans.
- “Low views = shadowban”: Not necessarily. Algorithmic distribution, topic interest, timing, and media type are usually the drivers.
- “High views = success”: Only if aligned with your goal (engagement, clicks, signups). Optimize for outcomes, not just raw exposure.
---
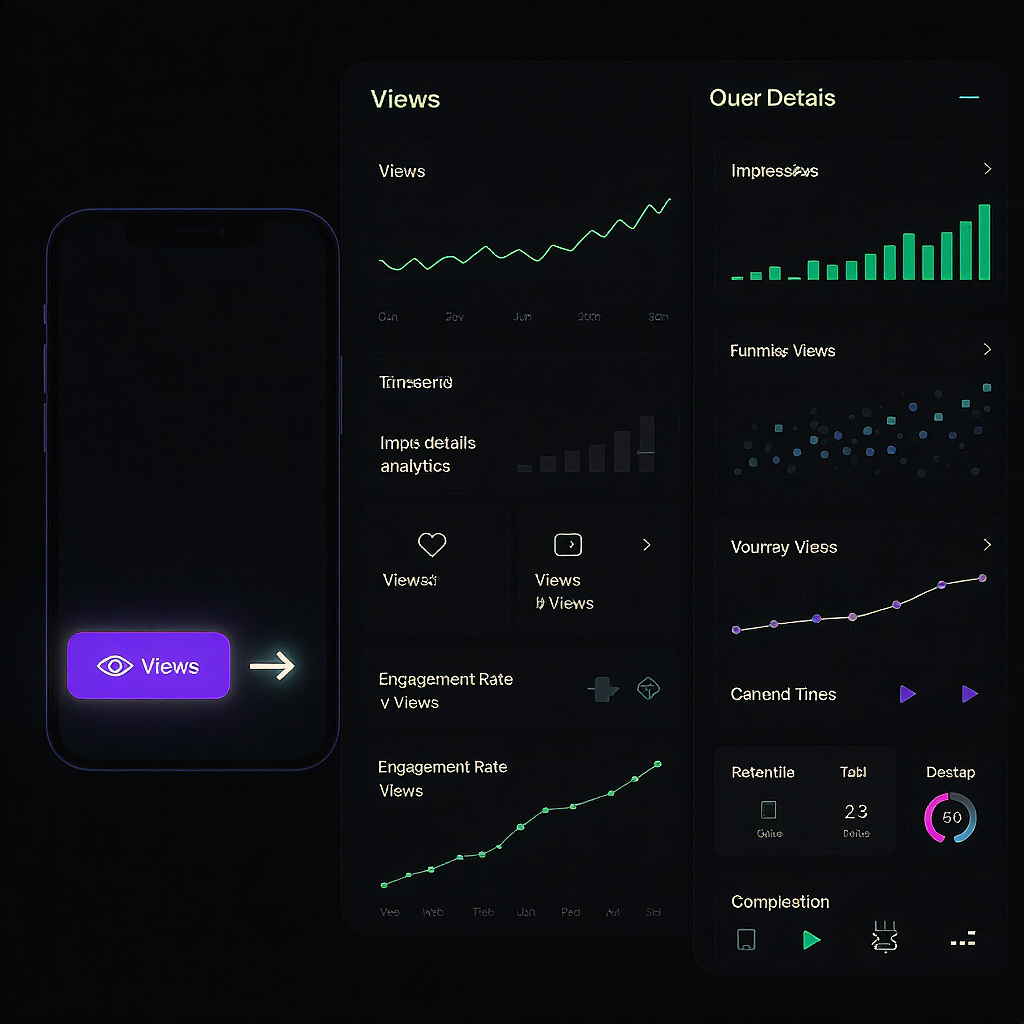
Where to find your view data
Per-post counters:
- In the timeline and on the tweet permalink, you’ll see the public “Views” count.
- Click “View post analytics” (three-dot menu or the analytics icon) to see:
- Impressions, detail expands, engagement rate, profile clicks.
- Link clicks, media expansions, hashtag clicks (when applicable).
X Analytics panels:
- Web: From your profile (or Professional Tools), open Analytics to access account-level charts.
- Exports: Some accounts can export post-level CSVs; availability varies.
- Tip: Snap weekly screenshots or exports so you aren’t dependent on interface changes.
Video analytics:
- View count (autoplay/click-to-play threshold met).
- Average watch time and retention curve.
- Completions and quartile milestones (25/50/75/100%).
- Device and player context (app vs web) where available.
Third‑party tools and API limitations:
- Since 2023, X’s APIs require paid tiers for most detailed metrics; many tools show partial data or sampled estimates.
- Beware tools promising “unique reach” for all tweets—they’re usually modeling, not measuring.
- For accuracy, rely on X’s native analytics for ground truth and use third‑party tools for workflow and reporting convenience.
---
Algorithm factors that influence views
X’s ranking systems evolve, but the following consistently matter:
- Freshness: Newer posts are prioritized; recency decay is steep.
- Author credibility: Account health, history of quality posts, and reduced policy violations improve distribution.
- Engagement velocity: Early likes, replies, and shares from credible accounts are a strong positive signal.
- Media type:
- Images often outperform plain text for attention.
- Native video can earn additional placements and dwell time.
- External links can suppress reach if they reduce on-platform time.
- Topical relevance: Keywords, entities, and hashtags that match active interests and Trends perform better.
- Hashtags: Useful for discovery within topics; overuse hurts readability and can look spammy.
- Timing: Posting when your audience is active increases first-hour velocity.
---
Tactics to increase tweet views ethically
- Lead with a hook: Put the payoff in the first 80–120 characters to win the stop.
- Go visual-forward:
- Use a single strong image or a succinct 2–4 frame carousel rather than dense text.
- For data, add a clean chart or diagram.
- Concise threads:
- 3–6 tweets with distinct takeaways outperform sprawling 20-tweet chains.
- Make each tweet independently valuable.
- Native video:
- Upload directly to X; avoid third-party players.
- Add captions for silent autoplay viewers.
- Accessibility that boosts discovery:
- Write descriptive alt text; X indexes it for search and it helps screen readers.
- Use CamelCase in hashtags (e.g., #OpenAIDevDay) for readability.
- Smart hashtags:
- 1–2 targeted tags; place them at the end to preserve flow.
- Reply-first networking:
- Thoughtful replies to relevant large accounts can seed engagement and funnel attention to your own posts.
- Minimize friction:
- If you must share a link, summarize the key value in-post so it stands alone.
- Iteration:
- Rephrase and repost a strong idea weeks later with a new angle or visual; don’t copy-paste.
---
Posting cadence and timing
- How often to post:
- 1–3 quality posts per day is sustainable for most brands.
- Add 2–5 value-adding replies to others per day for discovery without fatiguing followers.
- Find your audience’s active windows:
- Check per-post analytics for time-of-day performance.
- Look at when replies and retweets arrive in the first hour.
- Run small experiments:
- Post the same theme at three dayparts (e.g., morning, midday, evening) across different weekdays for two weeks.
- Keep media type, length, and call to action constant to isolate timing effects.
- Protect quality:
- If output quality dips, reduce frequency rather than filling slots with filler.
---
Video views specifics
What counts as a video view:
- A video view is typically counted when either:
- The video autoplays for at least about 2 seconds with ≥50% of the player in view, or
- The user clicks to play.
- Note: Exact thresholds can change; use the retention graph and completions to assess real watchership, not just the view count.
Ideal specs that balance reach and retention:
- Length: Aim for 15–45 seconds for broad audience posts; keep the core message in the first 3–5 seconds.
- Aspect ratio: 1:1 (square) or 9:16 (vertical) for mobile-first feeds; 16:9 works for landscape demos.
- Resolution/bitrate: Upload the highest quality you have within your account’s limits; captions should remain crisp.
- Captions: Provide burned-in captions or an SRT if available to capture silent autoplay.
- Thumbnails: Pick a high-contrast frame with a human face or bold headline.
Optimizing the retention curve:
- Cold open: Start with motion or the result first, then explain.
- Jump cuts and pacing: Remove dead air; keep average shot length short.
- On-screen text: Reinforce the hook and milestones (Step 1, Step 2).
- CTA placement: Place your primary CTA by 70–80% of runtime; many viewers bail before the end.
---
Search and distribution on and off X
- Keyword your copy:
- Use the terms your audience searches for in the first sentence (e.g., “twitter views,” “X analytics,” “video retention”).
- Profile-level SEO:
- Add key topics to your display name and bio (tastefully) to rank in on-platform search.
- Alt text:
- Include descriptive keywords where natural; helps discovery and accessibility.
- Leverage Trends, Communities, Lists:
- Join relevant Communities; posts may get a second life in those feeds.
- Curate Lists to monitor and engage with niche conversations quickly.
- Off-platform embedding:
- Embed tweets in blog posts and docs to earn Google visibility; this can drive back-discovery without cannibalizing on-platform engagement if the embed includes context that entices a click-through.
---
Quality and policy considerations
- Avoid low-quality signals:
- Link dumping, repetitive emojis, tag spamming, and mass-mention chains degrade distribution.
- Repetition:
- Reposting identical creative too frequently can reduce performance; vary the angle or creative.
- Sensitive media:
- Mark sensitive content appropriately; mislabeled media can reduce visibility or add interstitials.
- “Shadowbans” vs real constraints:
- X applies downranking and visibility limits for policy violations and low-quality behaviors.
- If reach suddenly drops, check account health, recent reports, and content mix before assuming a ban.
---
Measurement framework
Define success before you post:
- Awareness: Impressions/views, unique profile visits, video quartile reach.
- Engagement: Likes, replies, reposts, bookmark rate, engaged time.
- Traffic: Link clicks, landing page sessions, conversions attributed from X.
Benchmarks by account size (directional, not absolute):
| Follower size | Median views per post | Engagement rate (engagements/views) | Video completion rate (to 100%) |
|---|---|---|---|
| <10K | 1K–5K | 1.5%–3.5% | 5%–15% |
| 10K–100K | 5K–50K | 1.0%–2.5% | 4%–12% |
| 100K+ | 50K–500K+ | 0.7%–2.0% | 3%–10% |
Build a lightweight dashboard:
- Track per-post: date/time, topic, media type, hashtags, Views (public), Impressions (analytics), engagements, link clicks, video quartiles.
- Add UTM parameters to links so you can validate traffic in analytics tools.
Example UTM builder snippet:
https://yourdomain.com/landing?utm_source=x&utm_medium=social&utm_campaign=product_launch&utm_content=hook_variation_aA/B testing on X (practical approach):
- Variables to test: hook line, thumbnail/frame, media type (image vs short video), presence of external link, posting time.
- Method:
- Post two variations at similar dayparts on different days of the same week.
- Keep audience overlap in mind—don’t run back-to-back within an hour.
- Use ratios, not absolutes: engagement rate and watch time normalize for timing variance.
- Sample size rule of thumb:
- Aim for 2–3 iterations of each variation before drawing conclusions.
- If your median Views are low, aggregate multiple posts in the same variant to reduce noise.
What to review weekly:
- Top 5 posts by Views and by engagement rate—are they the same? If not, split your strategy for reach vs. interaction.
- First-hour performance: Which posts break out early? Double down on their characteristics.
- Decay analysis: How long does a post keep earning Views? Try retouching with a quote tweet 24–48 hours later if it’s still climbing.
---
Quick checklist before you post
- Is the first line strong and keyworded for your audience?
- Is there a clear visual or crisp layout?
- Are 1–2 relevant hashtags added, in CamelCase?
- Does every image have descriptive alt text?
- If video: is the hook in the first 3 seconds, with captions on?
- Is there a single, clear CTA aligned to your goal?
- Are you posting in a known active window for your audience?
---
Bottom line
“Twitter views” on X are a useful—but imperfect—signal. Treat the public view counter as a fast proxy for exposure, the Analytics impressions as your operational KPI, and video analytics as your quality bar for attention. Grow views by serving the algorithm and your audience at the same time: sharp hooks, crisp visuals, accessible content, and respectful cadence. Measure what matters, test small, and iterate.