Pixel Resolution Chart Explained with Common Display Sizes
Learn how to read a pixel resolution chart, understand common display sizes, and match resolutions to devices for optimal clarity and compatibility.

Introduction to Pixel Resolution Charts and Their Importance
Pixel resolution charts help visualize the number of pixels in a display or image, typically expressed as width × height (e.g., 1920×1080). This value determines visual detail, clarity, and sharpness—critical in photography, video editing, gaming, and graphic design. A well-structured pixel resolution chart serves as a quick reference for matching content requirements to hardware capabilities.
Understanding pixel resolution is essential because:
- It impacts visual quality across digital and print media.
- Determines file size and device memory usage.
- Ensures compatibility between different screens and source files.

Whether you’re a designer, developer, or content creator, knowing how to accurately read and interpret a pixel resolution chart will help you achieve optimal results while avoiding scaling issues.
---
Difference Between Pixel Resolution and Image Resolution
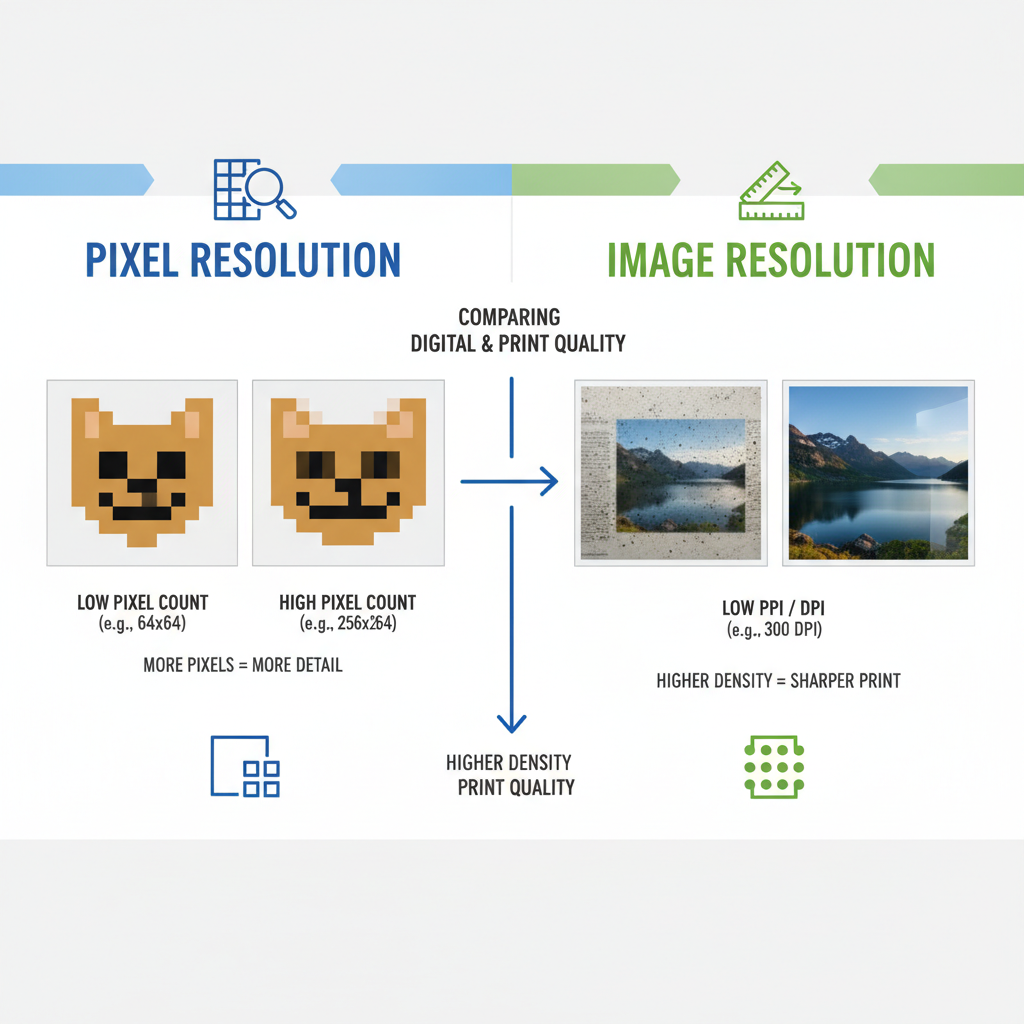
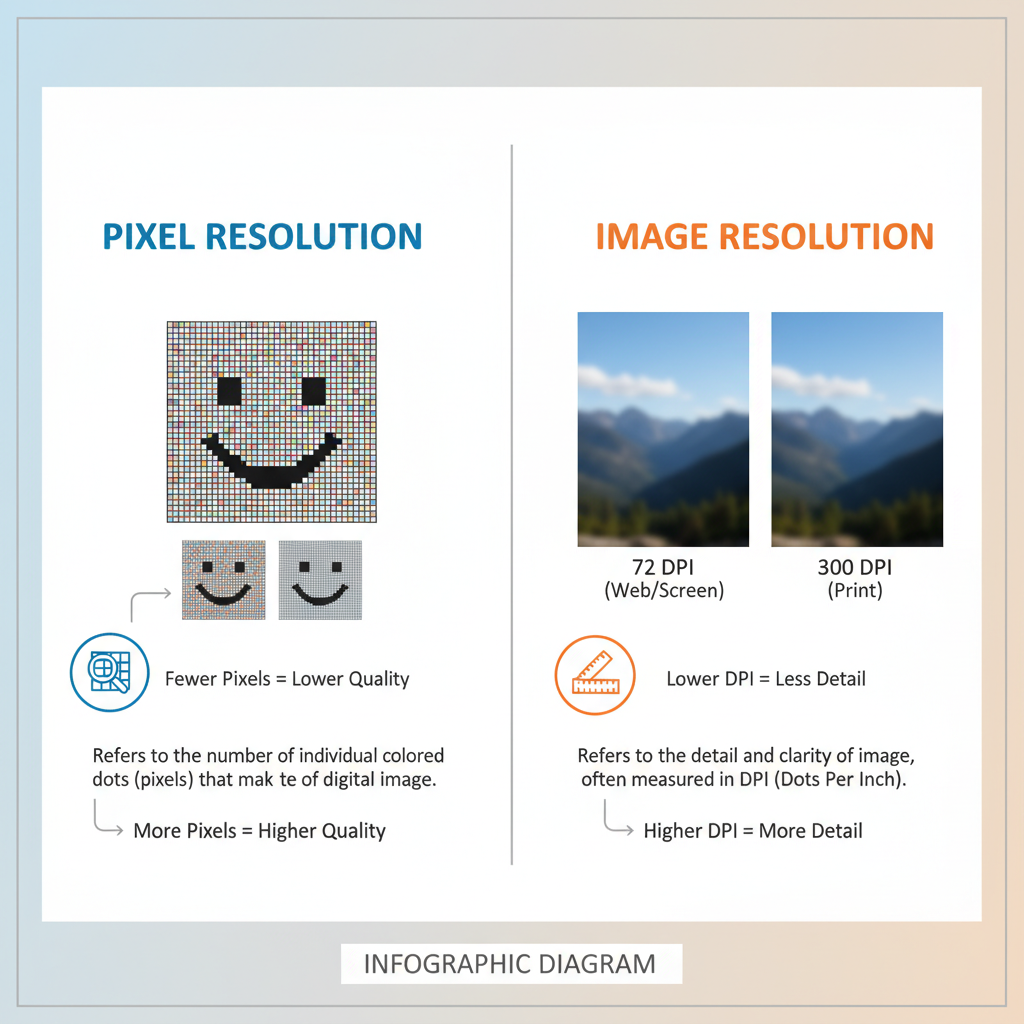
While “pixel resolution” and “image resolution” are related, they are not interchangeable terms.
- Pixel Resolution: A purely digital specification defining the number of pixels along the width and height of a visual asset or display.
- Image Resolution: Usually expressed in DPI (dots per inch) or PPI (pixels per inch). It incorporates the physical dimensions, influencing print output and quality.
Example comparisons:
- A 1920×1080 image at 72 PPI is ideal for web usage but unsuitable for large-format printing.
- The same pixel resolution with 300 PPI, scaled properly, can yield sharp, high-quality prints.
---
Standard Display Resolutions Explained
In marketing terms, resolutions are often expressed as 720p, 1080p, or 4K, where “p” means progressive scan, referring to the vertical pixel count.
Common resolution formats include:
| Resolution Name | Pixel Count | Aspect Ratio | Typical Use |
|---|---|---|---|
| 720p (HD) | 1280 × 720 | 16:9 | Entry-level HDTVs, streaming, low-end laptops |
| 1080p (Full HD) | 1920 × 1080 | 16:9 | Most TVs, monitors, web videos |
| 1440p (Quad HD) | 2560 × 1440 | 16:9 | Gaming monitors, high-end laptops |
| 4K (Ultra HD) | 3840 × 2160 | 16:9 | Premium TVs, content creation |
| 8K | 7680 × 4320 | 16:9 | Cutting-edge displays, film production |
---
How to Read a Pixel Resolution Chart
A pixel resolution chart displays resolutions with width values on the horizontal axis and height values on the vertical axis.

Key elements:
- Horizontal Axis – Number of pixels across the width.
- Vertical Axis – Number of pixels along the height.
- Data Points – Each resolution position represents its pixel width and height.
- Scaling – Can be linear or logarithmic to display a wide range effectively.
Tips for reading:
- Resolutions plotted further right and higher on the chart have more total pixels and finer detail.
- Diagonal comparisons indicate pixel area differences—for instance, 4K has roughly four times the pixel area of 1080p.
---
Common Resolutions for Different Devices
Device types vary widely in standard resolutions:
Smartphones
- Entry-level: 720p (HD)
- Mid-range: 1080p (Full HD)
- Flagship: 1440p or 4K AMOLED panels
Tablets
- Basic: 1280×800 (16:10)
- Premium: 2560×1600 with high refresh rate capabilities
Monitors
- Office work: 1080p in 21–27″ screens
- Gaming: 1440p or 4K with high refresh rates
- Ultrawide: 3440×1440 (21:9 aspect ratio)
TVs
- Budget: 1080p HDTVs
- Mainstream: 4K UHD
- High-end: 8K for ultra-fine detail and cinematic viewing
---
Aspect Ratios and Their Impact on Resolution Charts
Aspect ratio is the proportional relationship between width and height:
- 4:3 — Traditional monitors and some tablets.
- 16:9 — Standard for most HDTVs, monitors, and laptops.
- 21:9 — Ultrawide monitors and cinema-style viewing.
Aspect ratio influences the way resolutions appear on charts, since two formats with the same pixel total may display vastly different shapes and viewing experiences.
---
Printing vs. Digital Resolution: DPI, PPI, and Scaling
When preparing images for print:
- DPI refers to printer dot density.
- PPI refers to the digital image pixel density.
For screens:
- Scaling is the process of mapping source pixels to display pixels.
- Poor scaling can result in blurry visuals or aliasing artifacts.
Example: Printing a 1920×1080 image at 300 PPI produces a smaller print than at 72 PPI but delivers greater sharpness.
---
Creating Your Own Pixel Resolution Chart
Custom pixel resolution charts can aid designers, developers, and video editors in visual planning.
Tools to use:
- Adobe Illustrator — Precision vector charts.
- Inkscape — Free vector graphic software.
- Excel / Google Sheets — Scatter plot creation.
- Python with Matplotlib — Automated chart generation.
import matplotlib.pyplot as plt

resolutions = {
    '720p': (1280, 720),
    '1080p': (1920, 1080),
    '4K': (3840, 2160),
    '8K': (7680, 4320)
}

for name, (w, h) in resolutions.items():
    plt.scatter(w, h, label=name)

plt.xlabel('Width (pixels)')
plt.ylabel('Height (pixels)')
plt.legend()
plt.title('Pixel Resolution Chart Example')
plt.show()
---
Tips for Choosing the Right Resolution
Practical guidelines:
- Consider the target medium — Requirements for print differ from those for web or broadcast.
- Balance quality and performance — High resolution increases detail but can tax hardware.
- Match aspect ratio to content — Avoid unwanted cropping or letterboxing.
- Plan for future needs — Higher resolutions offer more flexibility for repurposing content.
---
Downloadable Reference Charts and Effective Use
Advantages of reference charts:
- Quickly compare resolutions without complex calculations.
- Vector PDF charts can be printed and used offline.
- Useful for collaborative design or production meetings.
Best practices:
- Keep charts accessible during creative planning sessions.
- Cross-check source file resolution with output device specifications.
- Annotate charts with relevant DPI/PPI notes for projects spanning print and digital media.
---
Conclusion: Mastering Pixel Resolution for Superior Visuals
Pixel resolution charts are invaluable for aligning content with display capabilities, from smartphones to high-end cinema screens. By understanding the relationships between pixel counts, aspect ratios, and DPI/PPI values, you can produce sharper, more professional visuals across digital and print platforms.
Integrating resolution knowledge into your workflow ensures precision and quality in every project. Start using pixel resolution charts today to enhance your media output, streamline collaboration, and future-proof your designs.


