Analyzing Twitter Follower Statistics for Audience Growth
Learn how to analyze Twitter follower statistics to track growth, understand audience demographics, spot engagement trends, and refine content strategy.
Understanding Twitter Follower Statistics
Twitter follower statistics are a crucial component of social media marketing, providing insights into how your audience interacts with your account across time. For brands, influencers, and marketers, analyzing Twitter follower statistics reveals trends in growth, engagement, and audience composition — enabling you to optimize posting strategies, enhance content relevance, and build stronger relationships.
Follower statistics encompass both quantitative metrics (such as follower count and growth rate) and qualitative metrics (like interests, geographic location, and behavioral patterns). Together, they help you assess not just audience size but overall value aligned with your business and communication objectives.

---
Where to Access Follower Analytics in the Twitter/X Dashboard
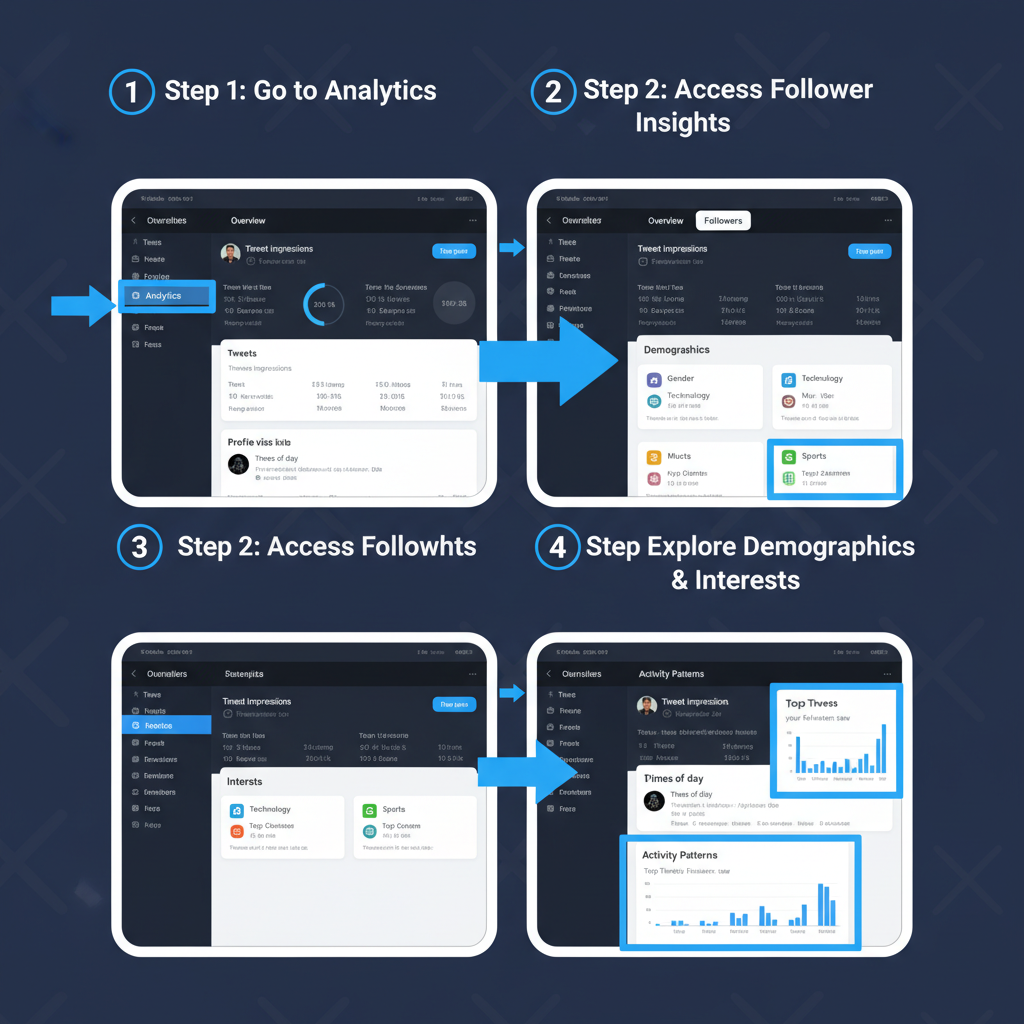
Twitter’s native analytics (accessible via https://analytics.twitter.com after login) provide a detailed snapshot of follower data. Within the “Followers” tab, you can view:
- Total Followers — Current audience size in number form.
- Growth Trend — Graph depicting increases or decreases over time.
- Top Locations — Countries and cities your followers reside in.
- Interests — Categories and topics your followers engage with most.
- Gender Breakdown — Demographic percentages by gender.
An alternative is the Twitter/X Professional Dashboard under “Audience,” where you can access more segmented and specialized demographic metrics to refine content alignment.
---
Key Metrics in Twitter Follower Statistics
Follower Count
A basic but essential indicator. It shows the number of accounts following you — but interpretation requires context to avoid overvaluing vanity metrics.
Growth Rate
The percentage change in followers over a period. A sustainable growth rate reflects effective engagement tactics, increased visibility, and consistent content delivery.
Demographics
Age, gender, location, and language details allow precise targeting and tailor-made messaging.
Interests
Data on the topics your audience cares about, empowering you to align messages with their preferences for greater interaction.

---
Analyzing Follower Activity Patterns
Understanding follower activity trends is key to maximizing reach:
- Time Zones — Identify geographic spread to schedule posts at optimal local times.
- Online Times — Recognize peak browsing hours to boost visibility.
- Engagement Rates — Track likes, retweets, and replies in proportion to follower count for a quality engagement perspective.
---
Tracking Follower Changes: Gains and Losses
Monitoring follower changes daily or weekly offers valuable clues:
- Content Impact — Identify which posts correspond with spikes in new follows.
- External Factors — Recognize external events or third-party mentions influencing growth.
- Negative Signals — Spot sudden drops that may indicate audience dissatisfaction or periodic account purges.
---
Leveraging Third-Party Tools for Deep Analytics
Native analytics are solid, but additional tools provide expanded views:
| Tool | Strengths | Data Depth |
|---|---|---|
| Followerwonk | Detailed demographics and bio text analysis | High |
| Tweepsmap | Location-based insights and posting optimization | Medium |
| Twitter Audit | Detection of fake followers | Low (specific purpose) |
| Social Blade | Long-term growth history tracking | High |
---
Interpreting Data for Content Strategy
Follower statistics should inform both content and scheduling:
- Content Themes — Align topics with analytics-derived interests.
- Frequency — Increase posts when follower activity peaks.
- Format Choices — Experiment with media formats to suit engagement habits.
---
Comparing Audience Growth with Engagement
Having many followers doesn’t guarantee influence. Compare:
- Likes per 1,000 followers
- Retweets per post
- Reply rates
If engagement is low, emphasize relevance and interaction over sheer volume.
---
Detecting Fake or Inactive Followers
Fake or inactive accounts dilute performance metrics and hinder algorithmic reach. Use verification tools to curate your follower list. Benefits include:
- Algorithmic Trust — Higher authentic engagement improves discoverability.
- Metric Accuracy — Precise understanding of your audience’s actual value.
---
Setting Measurable Growth Goals
Apply the SMART framework to set focused aims:
- Specific — “Gain 500 followers.”
- Measurable — Track via analytics dashboard.
- Achievable — Based on historical patterns.
- Relevant — Tie to brand expansion objectives.
- Time-bound — Achieve within a set period (e.g., 3 months).
Track progress weekly for prompt strategy adjustments.
---
Case Study: Strategy Pivot by Analyzing Follower Stats
A technology blogger faced stagnant growth despite consistent posting. Analytics revealed:
- Audience concentrated in Asia-Pacific.
- Peak activity at 8 PM local time (GMT+8).
- Interests focused on AI and developer tools.
The blogger adjusted posting schedules and emphasized AI-heavy content, resulting in a doubling of follower growth within two months and a 35% boost in engagement.
---
Avoiding Common Interpretation Errors
Typical mistakes include:
- Overemphasis on follower count without engagement context.
- Neglecting demographic changes when refining content.
- Misjudging temporary drops as strategic failures.
- Failure to segment data for deeper analysis.
---
Actions to Harness Follower Statistics for Growth
- Monthly Audience Audits — Remove fakes/inactives.
- Post Scheduling Optimization — Based on time zone data.
- Content Calibration — Align with top interests and demographic segments.
- Format Experiments — Implement and measure engagement shifts.
- Weekly Tracking — Monitor both follower changes and engagement statistics.
---
Summary: Twitter follower statistics are more than vanity metrics — they are data-rich indicators guiding posting frequency, content themes, and audience targeting. By regularly auditing, analyzing activity patterns, and aligning content with follower interests, brands and creators can achieve sustainable growth coupled with genuine engagement.
Call to Action: Start tracking your Twitter follower statistics today and refine your social strategy to unlock higher engagement rates and long-term audience loyalty.