Unexpected! A Subtle Architecture Optimization Saved Over $10 Million in Cloud Costs

When Your Cloud Bill Spikes Without Warning
If your cloud costs keep climbing and you can’t figure out why — it’s time to take a closer look.

---
This Is Not a Flashy Story
This isn’t about machine learning hype or serving hundreds of millions of users.
It’s about a quiet architectural choice that saved over $10M in 3 years.
- Not eye-catching
- Didn’t win awards
- Changed everything
If you work on high-traffic services and see your database or Kubernetes spend steadily growing without clear cause, this lesson may change how you approach architecture.
---
The Month Our AWS Bill Exploded
It was a Friday.
The dashboard lit up — not from outages, but because our AWS cost forecast jumped 38% month-over-month.
No major product launches.
No big batch jobs.
No new regions.
Only slightly higher traffic.
Yet costs skyrocketed.
Slack questions started flying:
> "Did someone change auto-scaling?"
> "Instance type change?"
> "Is CloudWatch glitching?"
None of those were the answer.
It was a hidden problem — database connections.
---
The Hidden Cost of Connection Floods
Architecture looked fine:
Dozens of Spring Boot microservices, each with its own PostgreSQL connection pool.
Auto-scaling enabled.
More traffic → more Pods → elastic scaling.
The catch?
Each new Pod added 50–100 new DB connections.
Across 4 regions.
Math Check:
- 12 microservices
- 3 replicas each
- 4 regions
- 100 connections per Pod (HikariCP default)
Result: Over 14,000 potential concurrent connections to one DB cluster.
---
Why This Was Deadly
So many concurrent connections forced costly vertical scaling.
By consolidating connection management and adding a shared connection proxy, we cut idle connection waste by 70%.
A reminder: Invisible decisions often have the biggest impact.
---
The Architectural Reality
Old design:
           ┌─────────────┐
           │ Service A   ├─────────┐
           └─────────────┘         │
           ┌─────────────┐         │
           │ Service B   ├────────────┐
           └─────────────┘         │ │
           ┌─────────────┐         ▼ ▼
           │ Service C   ├──────▶ PostgreSQL
           └─────────────┘         ▲ ▲
                        ...         │ │
           ┌─────────────┐         │ │
           │ Service N   ├─────────┘ │
           └─────────────┘           │
                      Hundreds of long-lived connections
Each Pod was a ticking cost bomb.
---
Why Costs Blew Up
Auto-scaling + deployments → connection spikes without extra traffic.
We paid for:
- Unused connections
- Higher DB memory & CPU
- More read replicas
- Bigger instances
- More network transfer fees
PostgreSQL started failing silently, and latency soared.
The architecture, not the services, was the culprit.
---
The Simple Fix That Saved Millions
We didn’t:
- Rewrite services
- Change DB engines
- Switch to NoSQL
- Add Kafka
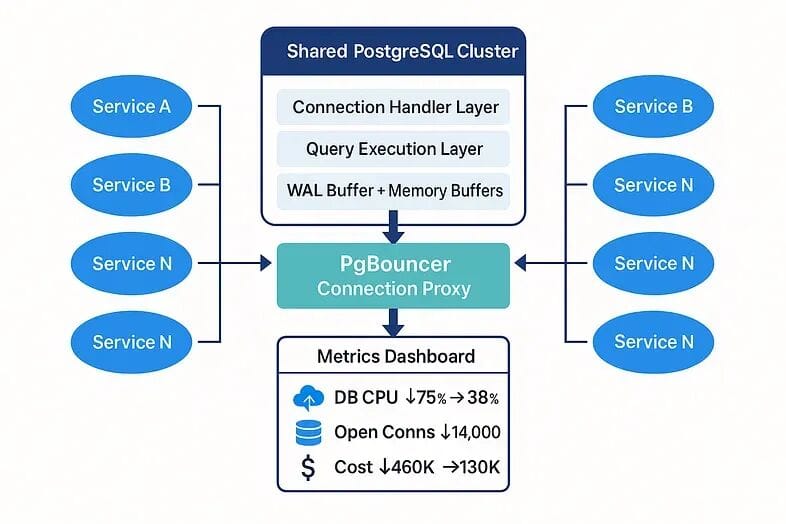
We introduced PgBouncer (transaction-pooling mode) in the Kubernetes cluster.
Now:
- Microservices talk to PgBouncer
- PgBouncer reuses & aggregates connections
- PostgreSQL can breathe
---
PgBouncer Architecture
           ┌──────────────┐
           │ Service A    ├──────┐
           └──────────────┘      │
           ┌──────────────┐      ▼
           │ Service B    ├──▶ PgBouncer ──▶ PostgreSQL
           └──────────────┘      ▲
                   ...           │
           ┌──────────────┐      │
           │ Service N    ├──────┘
           └──────────────┘
Connection pooling handled outside the app
---
Why PgBouncer Works
- Transaction mode returns connections immediately after query
- Slashes open connections (14,000 → <400 stable)
- Shields DB from connection storms
- Speeds up service startup
No application logic changes — only connection strings.
---
Spring Boot Setup Example
spring:
  datasource:
    url: jdbc:postgresql://pgbouncer-cluster:6432/mydb
    username: myuser
    password: ${DB_PASSWORD}
  hikari:
    maximum-pool-size: 20
    minimum-idle: 5
    idle-timeout: 30000
    connection-timeout: 20000
    max-lifetime: 600000
Port 6432 = PgBouncer default.
---
Production Gains
- 47% less DB memory use
- 22% faster Pod startup
- DB CPU under load dropped 75% → 38%
- DB nodes cut from 12 → 6
- $300K/month saved
3-year projection: $10.8M savings.
---
Why Nobody Talks About This
- Boring but impactful
- Not “disruptive”
- Invisible until it hits finance reports
---
When You Should Use PgBouncer
Consider PgBouncer, RDS Proxy, etc., when:
- 10+ microservices with auto-scaling
- DB spikes in memory/CPU during deployments
- Hitting `max_connections` regularly
- Oversized DB cluster just to avoid timeouts
- Services hang on DB connection at startup
---
Lessons Learned
- Default pool sizes can be dangerous
- HikariCP’s defaults aren’t always optimal.
- Auto-scaling can overload DBs
- Scaling surges create connection floods.
- Architecture choices drive cost savings
- Invisible problems are expensive
---
Key Takeaway
You don’t need a rewrite.
You need to check what you scale — throughput or connection count.
---
Have you hit similar bottlenecks?
Used PgBouncer or RDS Proxy?
Share your story — these behind-the-scenes decisions keep systems alive but rarely get recognition.
---