What Are Impressions on Twitter (X)? How They Work and Why They Matter
Learn what impressions mean on Twitter (X), how they’re counted across surfaces, where to find them in analytics, how they differ from reach and engagements.
Understanding how impressions work on Twitter (X) helps you interpret visibility, diagnose performance, and make smarter content decisions. This document explains what impressions are, how they’re counted across surfaces, where to find them, and how they differ from reach, engagements, and video views. You’ll also find practical guidance for interpreting trends, benchmarking, and sustainably increasing your impression volume.
What Are Impressions on Twitter (X)? How They Work and Why They Matter

If you’re serious about understanding performance on Twitter (X), you’ll run into “impressions” everywhere—from the counter under individual posts to charts in your analytics dashboards. Impressions are a foundational visibility metric. This guide breaks down what they are, how they’re counted, where to find them, and how to use them to make better content decisions.
Definition: What an Impression on Twitter (X) Actually Is
An impression is counted each time your Tweet is delivered on-screen to a user on X. Delivery can happen across many surfaces, including:
- Home timelines (For You/Following)
- Search results and trends
- Profile views
- Conversation (thread) views and Tweet detail pages
- Notifications and topic pages
- Official embedded Tweets on other websites
Key points:
- Impressions are not unique. The same person can generate multiple impressions if they see the Tweet more than once.
- Loading on-screen matters. The Tweet must be rendered (not just theoretically eligible for delivery).
- Impressions help you gauge potential visibility. They’re the denominator that makes engagement rate and click-through rate meaningful.
Where to Find Impressions
You can access impression data in a few places, with subtle differences across surfaces.
- Public Tweet view count
- Visible beneath most Tweets as “Views.” This is a top-line indicator of how many times the Tweet was viewed on X. Expect occasional small discrepancies relative to analytics due to filters, time windows, or eligibility.
- Tweet Activity (per-Tweet analytics)
- On desktop/mobile, open a Tweet and select “View Tweet activity” (bar chart icon). You’ll see impressions, engagements, link clicks, profile clicks, and more.
- Account-level Analytics
- Historically available at analytics.twitter.com to visualize daily/weekly/monthly impression totals, top Tweets, and engagement rates. Availability can change over time; access may vary by account.
- Ads Manager (for promoted content)
- When you run promoted Tweets, the Ads dashboard reports paid impressions (billable deliveries). You may also see total reach metrics and breakdowns by placement and targeting.
Tip: Numbers can differ slightly between public Views, Tweet Activity, and Ads due to attribution windows, anti-spam filtering, logged-out traffic, and organic vs paid delineations.
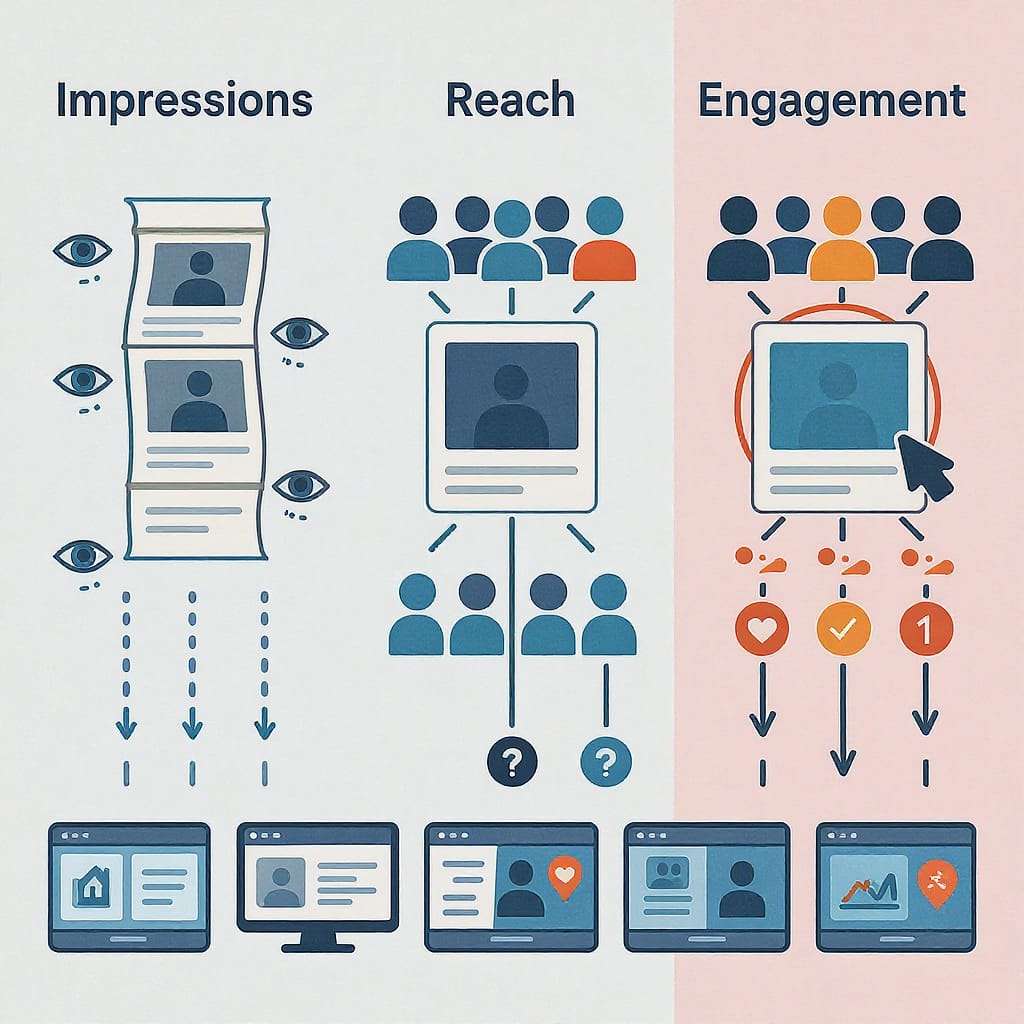
Impressions vs Reach vs Engagement
These terms are often conflated. Here’s how to separate them.
| Metric | What it measures | Unique? | Where it applies | Notes |
|---|---|---|---|---|
| Impressions | Number of times a Tweet was rendered on-screen | No | Organic + paid | Includes multiple views by the same user across surfaces |
| Reach / Unique viewers | Number of unique accounts that saw the Tweet | Yes | Typically Ads reporting; limited organic visibility | Not always available for organic Tweets |
| Engagements | All interactions (likes, replies, retweets, profile clicks, link clicks, detail expands, etc.) | No | Organic + paid | Often summarized as a total and by type |
| Engagement rate | Engagements divided by impressions | Derived metric | Organic + paid | Best for comparing content efficiency |
| Video views | Views that meet a video-specific threshold (e.g., time and viewability) | No | Organic + paid | Counted differently from impressions; definitions may vary by format |
Why it matters:
- A Tweet can have high impressions but low reach if a subset of users saw it multiple times.
- Engagement rate relates directly to impressions: it’s the share of views that resulted in an action.
- Video views are separate; they require a play or threshold and therefore will be fewer than impressions.
How Impressions Are Counted Across Surfaces
- Organic vs paid
- Organic impressions come from algorithms, follower timelines, search, profiles, and conversations.
- Paid impressions come from promoted placements and are tracked in Ads Manager. Total impressions for a promoted Tweet typically equal organic + paid.
- Retweets and Quote Tweets
- Retweets show your original Tweet to the retweeter’s audience, generating impressions for the original.
- Quote Tweets create a new Tweet (the quote) that can earn its own impressions; the original may receive additional impressions if viewers open the embedded card or expand the conversation.
- Replies in threads
- Replies can generate impressions in conversation views and timelines, especially if your followers interact. The original Tweet may also accumulate impressions as more users open the thread.
- Embedded Tweets
- Official embeds on websites that render the Tweet on-screen create additional impression opportunities. Screenshots or copy-paste text do not.
What Drives Impression Volume
Several levers determine how many impressions your Tweets get:
- Audience size and recency
- Active, recent followers are more likely to be shown your posts.
- Posting time and frequency
- Post when your audience is online; avoid flooding followers and triggering fatigue.
- Topic relevance and signals
- Alignment with trending topics, interests, and your account’s topical authority increases exposure.
- Use of media and hashtags
- Compelling images, short videos, and one or two relevant hashtags can lift visibility.
- Participation in live conversations
- Joining real-time events (news, sports, launches) can earn surfacing in For You and search.
- Network effects
- Retweets, Quote Tweets, and replies extend reach to adjacent audiences, creating compounding impression opportunities.
Interpreting Performance
Impressions are most useful in context. Use them as a lens, not a verdict.
- Set baselines
- Track a 28–90 day moving average of impressions per Tweet and impressions per day.
- Read trends, not blips
- Look for consistent uplift after strategy changes (e.g., visuals, posting cadence).
- Account for seasonality and news cycles
- Industry rhythms and major events can spike or suppress impressions.
- Distinguish outliers from repeatable wins
- A viral reply is great—but build playbooks from patterns you can reproduce.
- Avoid over-reliance on a single metric
- Pair impressions with engagement rate, link clicks, profile visits, and follows to assess real impact.
Compute engagement rate in a spreadsheet with a simple formula:
=IF(Impressions>0, Engagements/Impressions, 0)For campaign analysis, multiply by 100 to express as a percentage.
Benchmarks and Expectations
“Good” impression numbers vary by niche, content format, posting frequency, and account size. Use the ranges below as directional sanity checks—not hard targets.
| Follower size | Typical impressions per Tweet | Notes |
|---|---|---|
| < 1,000 | 50–500 | Heavy variance; replies and community engagement often outperform standalone posts |
| 1,000–10,000 | 200–3,000 | Media, threads, and timely topics can push the upper bound |
| 10,000–100,000 | 1,000–25,000 | Network effects become material; quote-Tweet strategy matters |
| 100,000+ | 5,000–100,000+ | Ceiling depends on topical authority and audience overlap |
Better than any universal benchmark is your own historical data. Build realistic targets from your trailing 90-day averages and aim for incremental improvements.
How to Increase Impressions (Ethically and Sustainably)
- Nail the hook
- Lead with a clear, curiosity-inducing first line. Avoid clickbait; deliver on the promise.
- Use strong visuals
- Images and short videos lift scannability. Add alt text for accessibility and search signals.
- Keep copy concise
- Front-load value; break long ideas into threads.
- Thread with intent
- Each Tweet should stand on its own while rewarding deeper reading.
- Collaborate and quote thoughtfully
- Quote-Tweet peers with original commentary; tag sources where appropriate.
- Time it smartly
- Post when your audience is active; test time zones and days of week.
- Tag topics sparingly
- One or two relevant hashtags or community tags are enough; over-tagging looks spammy.
- Participate in live conversations
- Comment early on breaking news or events where you have expertise.
- Maintain quality and consistency
- A steady cadence of helpful, on-brand content trains algorithms and audiences.
Troubleshooting and FAQs
- Do your own views count?
- Your own views can contribute to public view counts if the Tweet renders on-screen. Don’t obsess over this—it’s typically a negligible share.
- Do impressions equal unique people?
- No. Impressions count total on-screen deliveries, not unique viewers. One person can account for multiple impressions.
- Why might a Tweet show low impressions?
- Common causes include posting when your audience is offline, weak hook/visuals, low topical relevance, limited follower activity, or conversation placement (e.g., buried as a reply). Quality or policy issues can also reduce distribution.
- Why are public Views different from Analytics impressions?
- Differences can stem from anti-spam filtering, logged-in vs logged-out traffic, attribution windows, and organic vs paid delineations. Small variances are normal.
- How do retweets and replies affect impressions?
- Retweets expose your original Tweet to new audiences. Replies can gain impressions within threads and in follower timelines if they get engagement.
- Do embedded Tweets off-site count?
- Official embeds that render your Tweet can generate additional impressions. Copies/screenshots do not.
- When should you test formats or refresh strategy?
- If impressions and engagement rate trend down for 2–4 weeks, test: new hooks, visuals, shorter copy, threads, or different posting times. Revisit topics to align with what’s resonating.
Putting It All Together
Impressions tell you how often your Tweets are being seen; they’re the foundation for interpreting everything else. Track them over time, understand where they come from, and optimize the levers you control—hooks, visuals, timing, and participation in relevant conversations. Pair impressions with engagement metrics to find not just what gets seen, but what moves people to act.
With a clear baseline and steady experiments, you’ll build a healthier impression trendline—and, more importantly, an audience that keeps coming back.
Summary
Impressions measure on-screen deliveries of your Tweets across surfaces, making them the core visibility metric that powers engagement-rate and CTR analysis. Find them via public Views, Tweet Activity, analytics dashboards, and Ads Manager, and interpret them alongside reach and engagement to understand true performance. Improve impressions by refining hooks, visuals, timing, and participation in relevant conversations while maintaining consistent, high-quality output.