What Are Impressions on Twitter (X)? Meaning, How They’re Counted, and Why They Matter
Learn what impressions on X (Twitter) mean, how they’re counted, how they differ from reach, views and engagement, plus ethical ways to grow them.

This guide explains what impressions are on X (formerly Twitter), how they’re counted across different surfaces, and how they differ from reach, views, and engagement. You’ll also learn where to find impression data, how to interpret it in context, and practical ways to increase impressions ethically. Use it as a reference to align your content and analytics practices with platform realities.
What Are Impressions on X (formerly Twitter)?

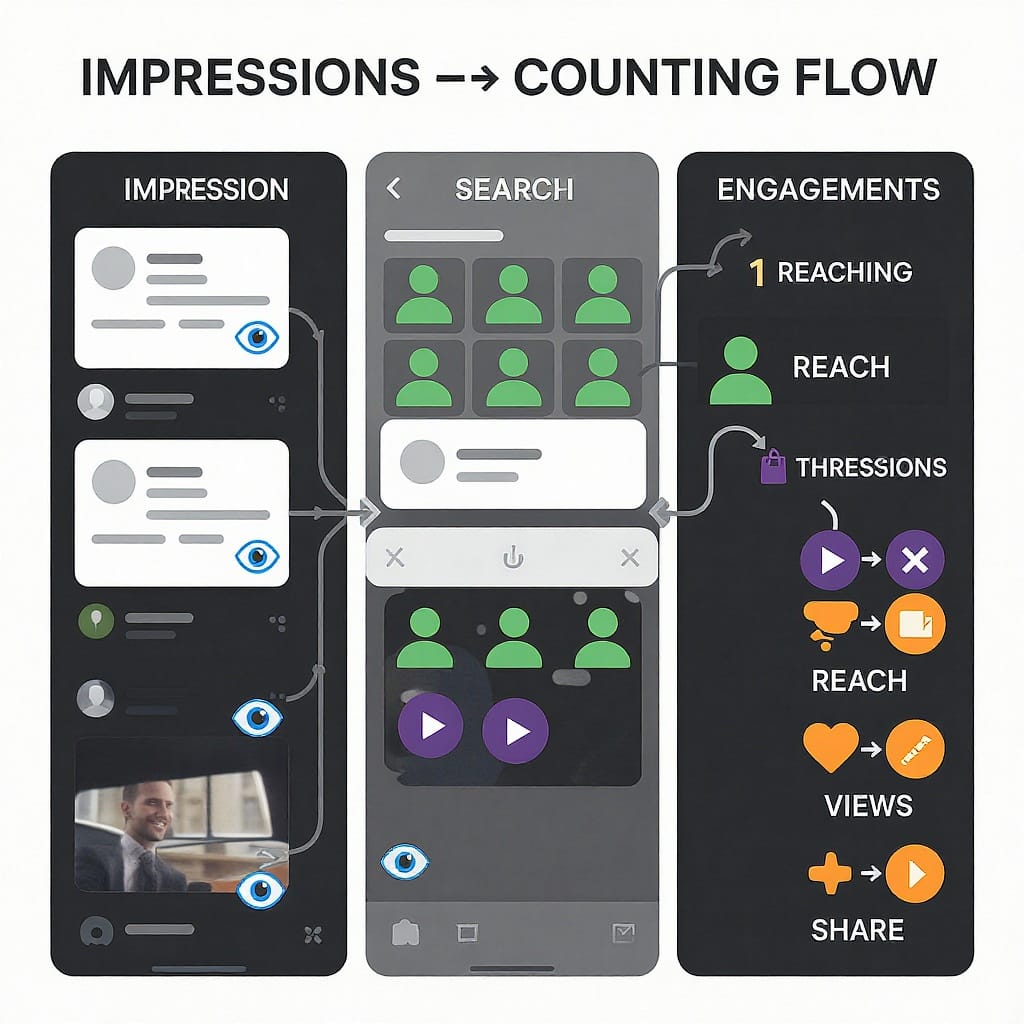
If you’ve ever wondered “what are the impressions on twitter,” here’s the plain-English answer: an impression is a count of how many times a post (Tweet) is displayed on X. It measures exposure, not preference or action. If your post shows up on someone’s Home timeline, in Search, or on your profile and is rendered on their screen, that’s an impression.
This is different from:
- A “view” in the video sense (which often requires a minimum play duration).
- An “engagement,” which requires an action (like, reply, repost, follow, click).
- “Reach,” which tries to count unique people rather than total exposures.
Important nuance: X’s public “View count” on a post (the number shown alongside likes and reposts) is a display of how many times that post has been seen on X surfaces. Inside X’s analytics, the same concept is typically labeled “Impressions.” They’re closely aligned, but the analytics interface remains the authoritative source for post-performance reporting.
How Impressions Are Counted
Impressions are tallied when your post is rendered on X surfaces, including:
- Home timeline (For You and Following tabs)
- Search results and Trends topic pages
- Tweet (post) detail page and conversation threads
- Your profile, Lists, Communities, and curated timelines
Additional considerations:
- Repeat exposures: If the same account sees your post multiple times across different surfaces or sessions, each exposure can count as a separate impression.
- Reposts and Quotes: Impressions generated via someone’s repost or quote-post can count toward the post being shown. In analytics, you may see combined exposure of the original post and distributions via other accounts; however, reposts/quotes also have their own analytics if you own those posts.
- Embeds: Official X embeds that render the post via the platform’s script may record impressions when the post is actually displayed. Third-party screenshots or non-instrumented displays won’t be counted.
- Notifications: Push or in-app notifications themselves are not impressions. If a user taps a notification and the post renders on-screen, that view can be counted as an impression.
- Logged-in vs logged-out: X can count exposures on both, but the analytics you see are based on X’s available tracking on its surfaces. Your analytics dashboard is the best source of truth for your own posts.
Caveat: X evolves its product and measurement pipelines. Always cross-check current definitions in the help center or ads documentation when you’re running critical campaigns.
Impressions vs. Reach vs. Views vs. Engagement
Here’s how these common metrics differ and when to use each.
| Metric | What it means | Deduplicated by person? | Repeat exposures counted? | Best used for | Common pitfalls |
|---|---|---|---|---|---|
| Impressions | Number of times your post was displayed on X surfaces. | No | Yes | Measuring distribution/visibility potential. | Assuming high impressions equals success without quality checks. |
| Reach | Estimated unique people who saw your post. | Yes (by design) | No | Comparing audience size across posts/campaigns. | Not always available natively; estimates can vary. |
| Post “View” (public counter) | Times your post has been seen on X; analogous to impressions. | No | Yes | Topline visibility (public-facing, quick read). | Confusing with “video views”; treating it as unique reach. |
| Engagement | Actions (likes, replies, reposts, profile taps, link clicks, etc.). | N/A | N/A | Assessing audience response and content resonance. | Comparing raw engagements without normalizing by impressions. |
| Video Views | Plays meeting X’s threshold (e.g., starts/seconds viewed). | No | Yes | Measuring video content consumption. | Assuming a video view equals a post impression. |
Key takeaway: Use impressions for distribution, engagements for response, and engagement rate per impression to normalize performance.
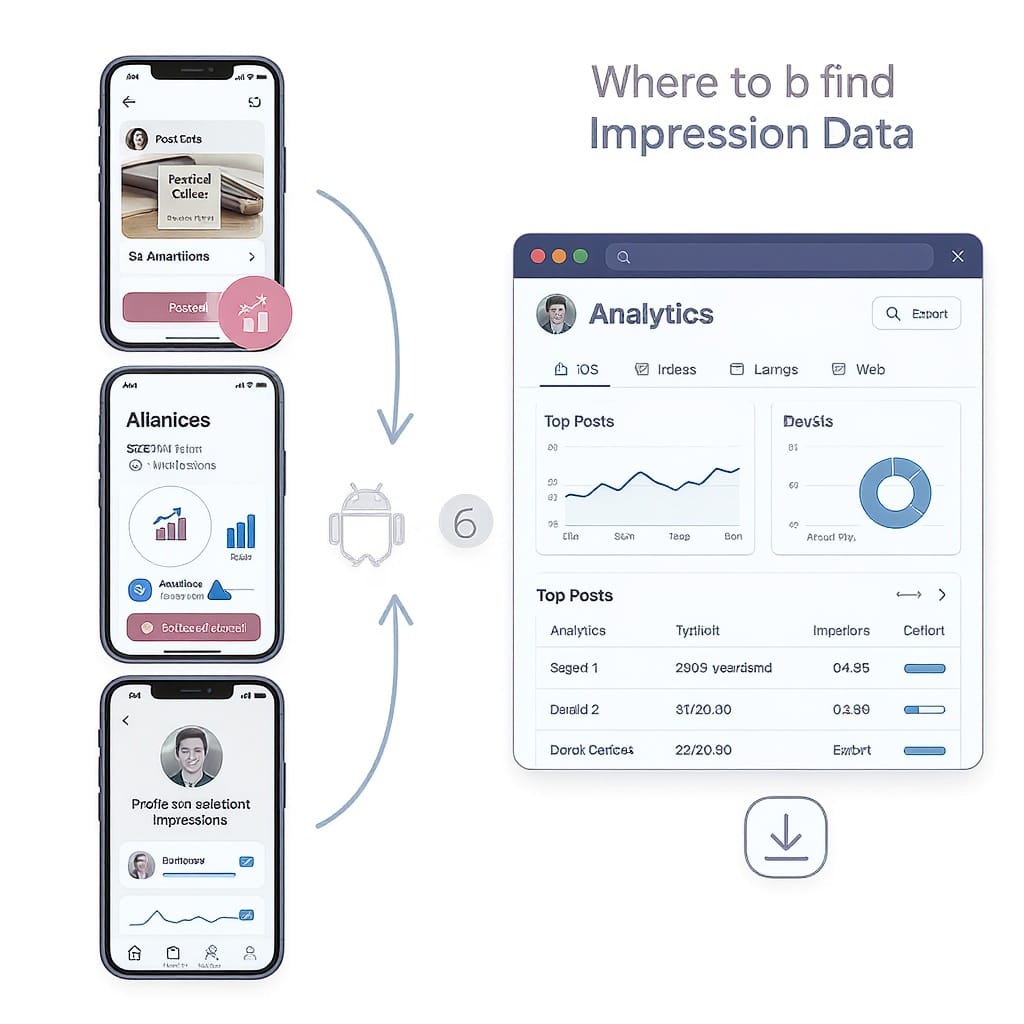
Where to Find Your Impression Data
Mobile (iOS/Android)
- Open X and navigate to one of your posts.
- Tap into the post to open the detail view.
- Tap “View post analytics” (bar-chart icon or the analytics link beneath the post).
- You’ll see Impressions, Engagements, and breakdowns (e.g., detail expands, profile visits, link clicks).
Web
- Open x.com and go to your profile.
- Click a post to open its detail view.
- Click “View post analytics” at the bottom of the post.
- Review Impressions and other metrics. Use the date picker in Analytics (if available) for broader windows.
Profile-level analytics and exports
- Visit analytics.twitter.com (or the Analytics link from your account menu). Availability can vary by region, account type, or current product state.
- In the Tweets section, you can view aggregate impression totals, top tweets, and export CSVs for deeper analysis.
- Ads Manager (ads.twitter.com) includes impressions for paid campaigns, ad groups, and creatives, with export features.
Caveats
- Some features are limited for protected accounts, new accounts, or those without Ads/Pro access.
- Product changes roll out frequently; if a menu item isn’t where described, search X’s help center for the latest path.
What Is a “Good” Number? Benchmarks and Context
There’s no universal “good” impression count—context rules:
- Follower base: Accounts under 5k followers often see wide variance; a strong post might reach 10–50% of followers in impressions, plus algorithmic reach beyond followers. Larger accounts (100k+) commonly see impressions that outscale follower count because of algorithmic distribution and repost networks.
- Niche vs. broad: Niche topics can earn lower absolute impressions but higher relevance and conversion quality.
- Content format: Native media (images, short videos, polls) can help distribution when they drive interaction and dwell.
Normalize performance with engagement rate (ER) per impression:
- Baseline for many accounts: 0.5%–2.5% ER (likes + replies + reposts + clicks + profile taps) per impression is a typical organic range. High-performing posts can exceed 3–5%.
- Track a rolling median rather than single-post bests to avoid survivorship bias.
A simple formula you can use:
Engagement Rate per Impression (%) = (Total Engagements / Impressions) * 100And if you’re working from a CSV export:
## quick ER calc from an Analytics export

import pandas as pd

df = pd.read_csv("x_tweet_activity.csv")
df["engagement_rate_impr"] = (df["engagements"] / df["impressions"]) * 100
print(df[["tweet_id", "impressions", "engagements", "engagement_rate_impr"]].head())
Factors That Influence Impressions
- Follower graph strength: Active, relevant followers amplify distribution via early engagement and reposts.
- Topical relevance: Posts tied to timely topics, communities, or trends surface more in Search and For You.
- Recency and consistency: Regular posting gives the algorithm fresh signals; stale accounts often lose baseline distribution.
- Early engagement and dwell: Rapid likes, replies, and time spent on the post (dwell) can lift further impressions.
- Author credibility: History of trustworthy, helpful content builds a reputation signal.
- Media types: Crisp images, short native videos, and well-formatted text (line breaks, bullets) improve scannability.
- Hashtags and keywords: Use sparingly and purposefully; stuffing can harm readability.
- Timing: Post when your core audience is online; test windows across weekdays/weekends.
- Conversation participation: Joining live conversations and replying thoughtfully can expose your handle to adjacent audiences.
Organic vs. Paid Impressions
- Definition: Paid impressions are counted when a promoted post is served on X surfaces (similar to organic), with the addition of ad placements and partner inventory applicable to your campaign.
- Frequency and pacing: Ads can show multiple times to the same user. Monitor frequency (impressions per user) to avoid fatigue; adjust budgets, bids, and audience size accordingly.
- Quality considerations: High impressions with low engagement rate may indicate poor creative-audience fit, targeting misalignment, or creative wear-out.
- Side-by-side interpretation: Compare organic and paid impressions alongside engagement rates and downstream actions (clicks, site visits, conversions) to understand the true value of exposure.
Tip: Separate reporting tabs for organic vs. paid keep your analysis clean, then bring them together in a summary chart with normalized rates.
Practical Ways to Increase Impressions Ethically
Content and structure:
- Lead with a compelling hook in the first 80–120 characters.
- Use strong visuals: 1–2 images or a punchy short video; ensure text is legible on mobile.
- Format for scanning: short sentences, line breaks, and minimal jargon.
- Add clear context: why it matters, what’s new, or what’s in it for the reader.
Distribution strategy:
- Post in strategic windows when your audience is active; test 3–5 time slots and iterate monthly.
- Thread wisely: Break complex ideas into 3–7 concise posts; keep each post valuable on its own.
- Participate in live conversations (industry events, product launches, news cycles) to ride real-time discovery.
- Collaborate: Cross-post with partners, quote-post peers with value-add commentary, and tag relevant sources sparingly.
Community and reputation:
- Reply promptly to early comments to compound visibility and foster conversation signals.
- Curate and share useful resources; generosity earns follows and future impressions.
- Consistency beats bursts: a sustainable cadence (e.g., 3–7 quality posts/week) tends to outperform sporadic spikes.
Measurement hygiene:
- Track ER per impression and link CTR to ensure you’re not optimizing for exposure at the expense of outcomes.
- Refresh creative every 2–4 weeks to avoid fatigue.
Common Pitfalls and Misconceptions
- Chasing vanity metrics: High impressions with weak engagement or poor downstream actions can be misleading.
- Bot or low-quality exposure: Sudden spikes from suspicious accounts inflate impressions without business value. Tighten audience focus and monitor quality signals.
- Confusing video views with impressions: Video view thresholds differ; don’t equate a play with a post impression.
- Overposting: Excess frequency can trigger follower fatigue and lower per-post performance.
- Misreading “reach”: Unless your tool explicitly provides deduplicated reach, don’t infer it from impressions.
- Ignoring context windows: Comparing a breaking-news post to a weekend evergreen post without adjusting for timing skews conclusions.
How to run clean A/B tests:
- Vary one element at a time (hook, image, length, CTA).
- Test in comparable time windows (same weekday/time) across two weeks.
- Use enough samples (e.g., at least 5–10 pairs) to smooth randomness.
- Judge on normalized metrics (ER per impression, CTR per impression).
- Confirm repeatability before rolling out changes.
Putting It All Together
- Impressions tell you how often your post was displayed; they’re the distribution baseline.
- Use impressions with engagement rate and conversion metrics to build a balanced performance view.
- Find impression data in post-level analytics on mobile/web and in account-level analytics or Ads Manager for exports.
- Improve impressions by crafting scannable, valuable content and by participating where your audience already gathers.
- Avoid the trap of “more eyeballs at any cost.” Sustainable growth comes from relevant exposure plus genuine engagement.
When someone asks “what are the impressions on twitter,” you can now answer confidently: they’re a count of exposures on X surfaces—useful, but only powerful when paired with quality, relevance, and clear goals.
Summary
Impressions on X are the total number of times a post is displayed across platform surfaces; they reflect distribution, not unique reach or engagement. Use impressions alongside engagement rate and downstream actions to judge content quality and business impact, and rely on X’s analytics for accurate reporting. To grow impressions responsibly, optimize for clarity, timing, and participation—not vanity metrics.