What Are Tweet Impressions? How X (Twitter) Counts Them, Why They Matter, and How to Grow Yours
Learn what tweet impressions on X (Twitter) mean, how they’re counted, where to find them, how they differ from reach and views, plus tactics to grow yours.

What Are Tweet Impressions? How X (Twitter) Counts Them, Why They Matter, and How to Grow Yours
If you’ve ever opened X (formerly Twitter) Analytics and wondered what “impressions” actually mean, you’re not alone. This guide explains what tweet impressions are, how X counts them, where to find yours, and the practical tactics that actually move the needle.
Definition: What Are Tweet Impressions on X?
A Tweet impression is counted each time your Tweet is served to a user on X or via an embedded timeline. No click is required.
“Served” covers a wide range of on-platform surfaces:
- Home timelines (For You and Following)
- Search results and Topics
- Lists and Communities
- Profile timelines (yours or others’)
- Replies/threads (including when your Tweet appears as a reply)
- Tweet detail pages
- Embedded timelines and embedded Tweets on websites and apps
Key nuances:
- Repeat views by the same account can count. Impressions are not unique.
- An impression generally indicates the Tweet was rendered or loaded—not that it was fully read.
- Visibility can occur without engagement (no like, reply, or click needed).
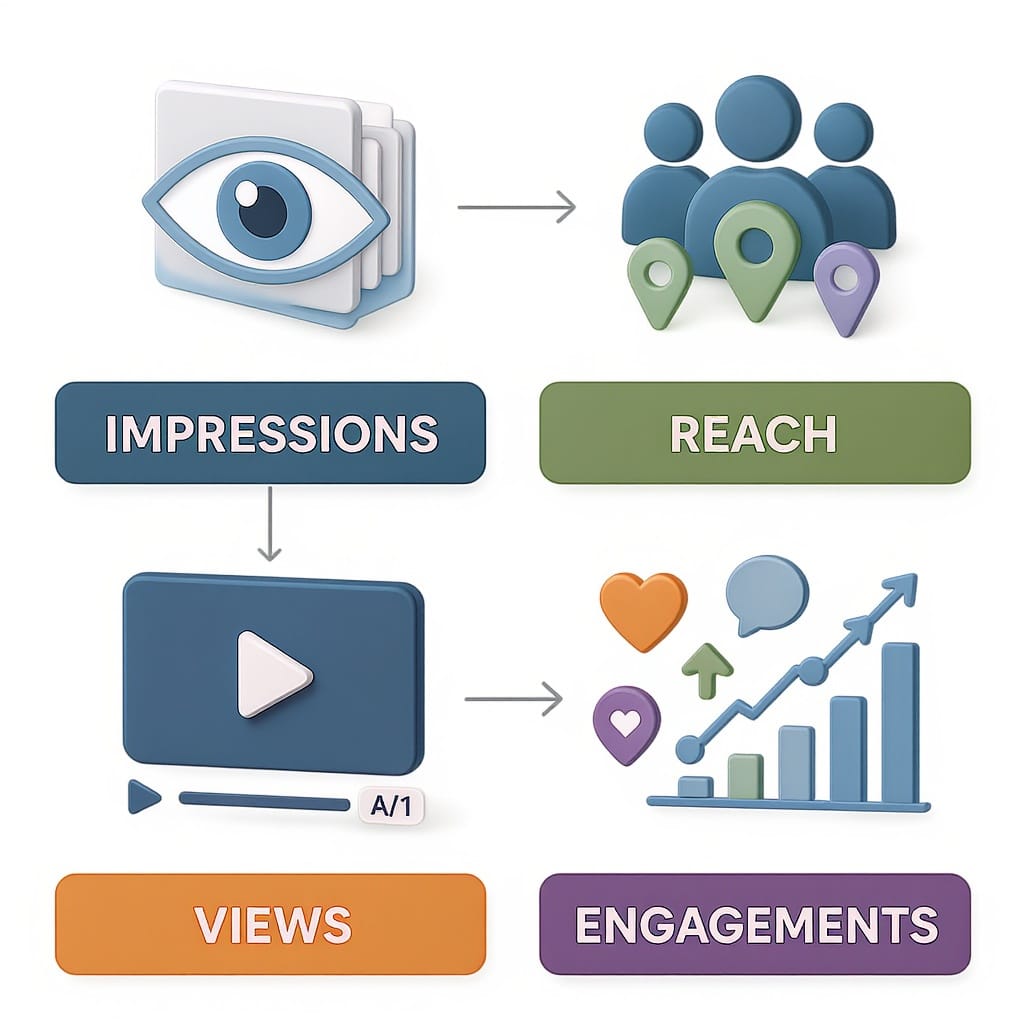
Impressions vs. Reach vs. Views vs. Engagements
These terms often get mixed up, but they’re not interchangeable.
| Metric | What it means | Where you’ll see it | Notes |
|---|---|---|---|
| Impressions | Times your Tweet was served/rendered on X or in an embed | Tweet Analytics, account analytics | Not unique; repeat exposure can count |
| Reach | Estimated unique accounts that saw your content | Often in broader social reports | Not a native X public number; usually modeled |
| Views (public label) | Visible counter on the Tweet detail (similar to impressions) | On the Tweet itself | Conceptually aligned with impressions; still not “unique” |
| Engagements | Actions taken: likes, replies, Reposts, profile clicks, link clicks, etc. | Tweet Analytics, account analytics | Used to compute engagement rate |
Engagement rate basics:
- Engagement rate by impressions = total engagements / impressions.
- Typical brand baselines often range from 0.5% to 2.0%, but creators and highly targeted accounts can be higher.
Example calculation:
Engagement rate = (likes + replies + Reposts + link clicks + profile clicks + other clicks) / impressionsWhere to Find Your Tweet Impressions
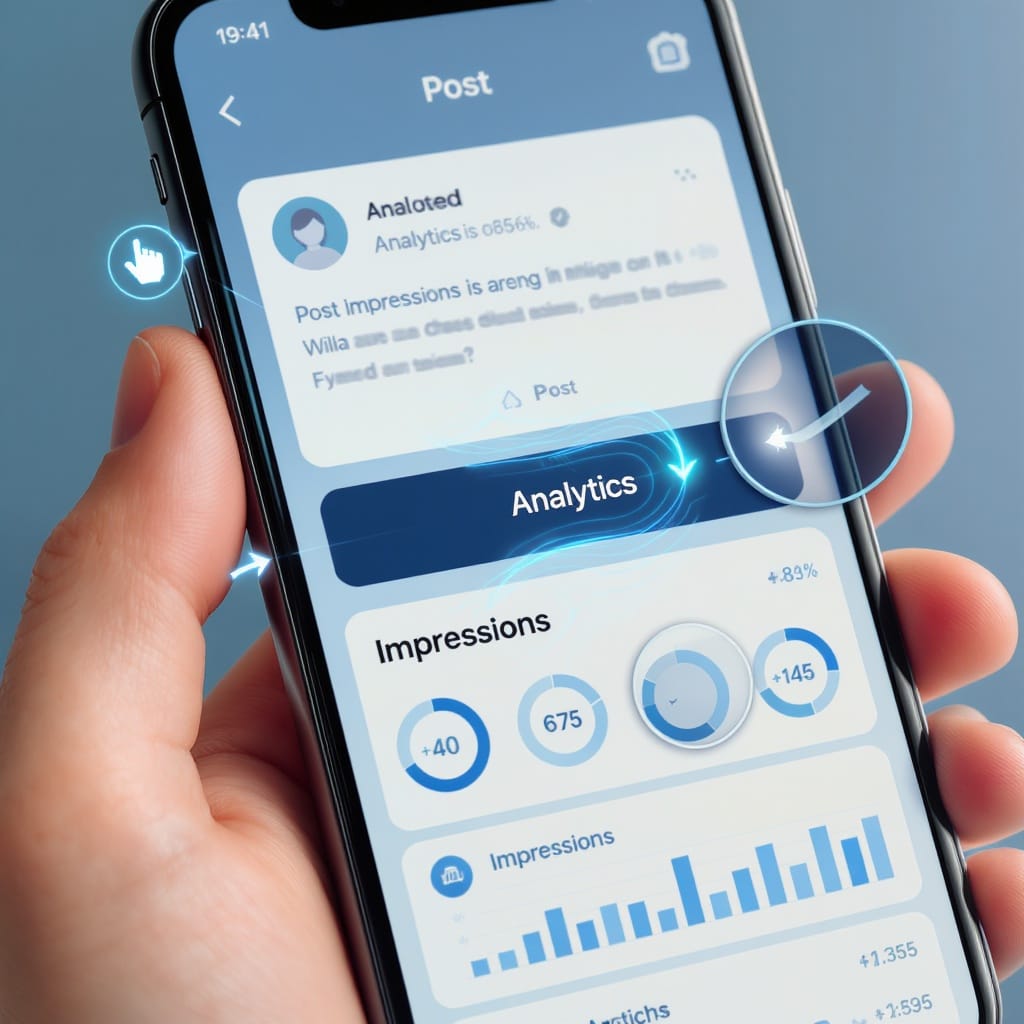
You can view impressions at the Tweet level and for your entire account.
- Public “views” counter on the Tweet
- Open a Tweet; you’ll see a visible views number. Treat this as a close proxy to impressions.
- Tweet Analytics card (desktop and mobile)
- Tap “View Tweet analytics” (or the bar chart icon) to see impressions, engagements, and a breakdown of actions.
- Account Analytics dashboard
- Access via your profile menu under professional/creator tools or analytics. You’ll get an overview of 28-day performance by default, per-Tweet data, and trend charts.
- Export CSVs for deeper analysis. You can usually adjust date ranges and filter by content types.
Tip: If you don’t see analytics, enable them in your account settings or professional/creator tools first.
How Impressions Are Counted Under the Hood
What triggers an impression:
- Serving your Tweet into an eligible surface (For You, Following, Search, Lists, Topics, profiles, replies) and embedded experiences.
- A user doesn’t need to interact; it’s about rendering/serving.
Timing and updates:
- Counts may update with a short delay due to aggregation and filtering.
- X applies quality checks to limit obvious spam and bot inflation. Sudden drops or small revisions can reflect these filters rather than “lost” traffic.
Important caveats:
- An impression does not guarantee attention or comprehension. It indicates delivery, not dwell time or reading.
- Some rapid repetitions (e.g., refreshing) may be throttled or deduplicated by anti-gaming systems.
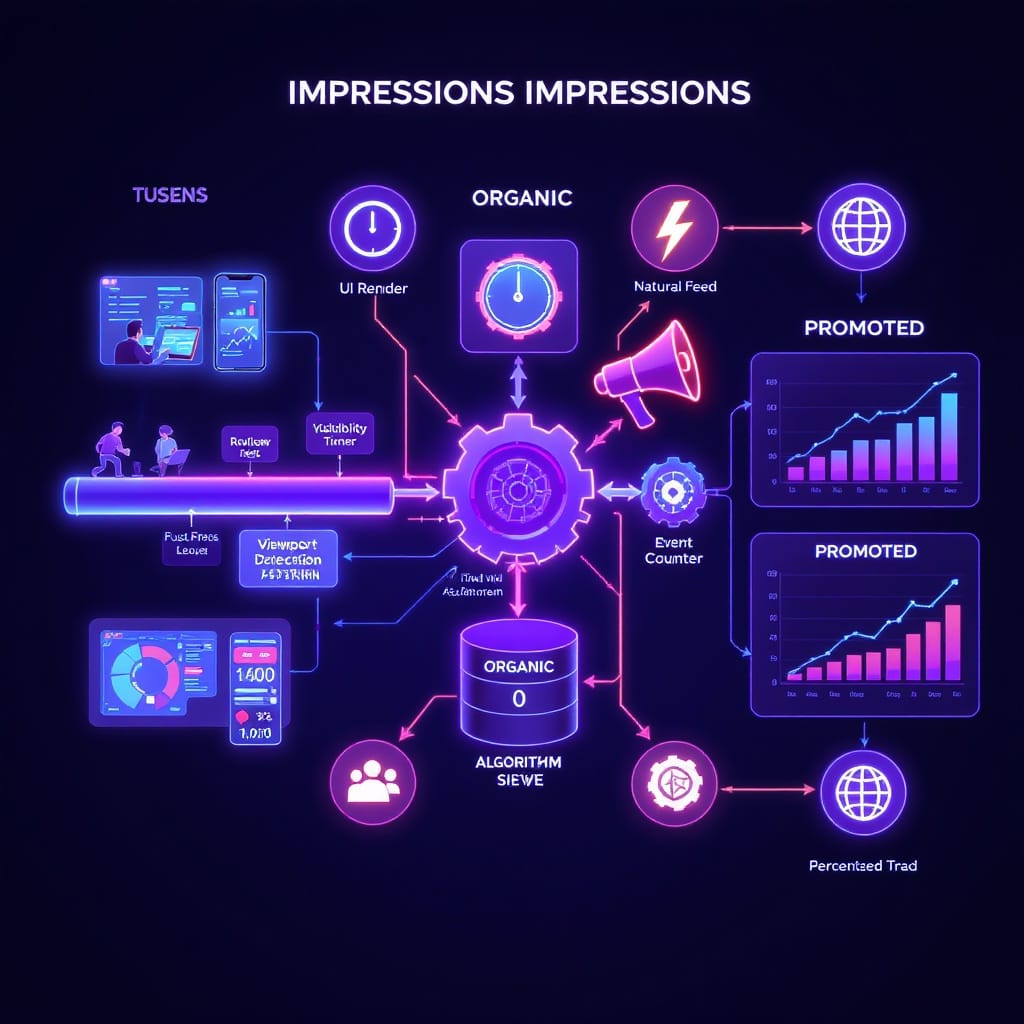
Organic vs. Promoted Impressions
- Organic impressions: All non-paid delivery—your followers’ feeds, algorithmic distribution, replies, search, embeds.
- Promoted impressions: Paid ad delivery via X Ads (formerly Twitter Ads). These show in placements like Home timelines, search results, profiles, and in-stream video.
- Total impressions: The sum of organic + promoted.
Why this matters:
- Paid promotion can boost organic distribution through secondary engagement (Reposts, likes, replies) that exposes your Tweet to new audiences.
- Ad reporting includes extra fields like frequency (avg. impressions per person), placement, and sometimes third-party viewability metrics for video. Use these to diagnose whether you need broader targeting (reach) or better creative (engagement).
What Is a Good Number? Benchmarks and Context
There’s no one-size-fits-all “good” impression count. Context wins:
- Follower size: Larger audiences can seed more initial delivery, but non-followers can still drive most of the reach on X.
- Content type: Images, videos, and informative threads often outperform single-line text.
- Industry and voice: Niche technical topics can be high-engagement but lower total impressions; broad pop culture can be the opposite.
- Cadence: Consistency outperforms sporadic posting.
Use these directional ranges as a starting point (not strict rules):
| Follower tier | Typical per-Tweet impressions | Engagement rate baseline | Notes |
|---|---|---|---|
| < 1,000 | 100–1,000 | 1.0%–5.0% | Breakout threads or replies to large accounts can spike |
| 1,000–10,000 | 500–10,000 | 0.8%–3.0% | Media and timely topics help 2–3x impressions |
| 10,000–100,000 | 2,000–50,000+ | 0.6%–2.0% | Audience fit and early engagement drive algorithmic lift |
| 100,000+ | 10,000–250,000+ (wide variance) | 0.3%–1.5% | Distribution can exceed follower count on viral posts |
Remember: High engagement rate with modest impressions often signals strong resonance within a smaller audience; huge impressions with low engagement can indicate weak fit or “scroll-by” exposure.
Key Factors That Drive Impressions
- Audience size and recency: Active, recent followers seed early delivery.
- Topic relevance: Clear topical signals and keywords help X understand who should see it.
- Media usage: Images, videos, and GIFs improve stop-rate and sharing.
- Thread structure: Multi-Tweet threads keep people engaged longer and create multiple surfaces for impressions.
- Hashtag/topic tagging: 0–2 highly relevant tags are enough; stuffing can reduce readability.
- Posting time: Publish when your audience is most active to earn fast early engagement.
- Replies/quotes: Thoughtful replies to larger accounts and quoting timely posts can expose your handle to adjacent audiences.
- Early engagement signals: Initial likes, replies, and saves indicate quality and can boost subsequent distribution.
How to Increase Tweet Impressions (Actionable Tactics)
- Nail the first line (the hook)
- Lead with the payoff: “The 3 pitfalls that tank your landing page conversion (and what to do instead).”
- Keep it scannable with short sentences and line breaks.
- Use high-contrast visuals
- Prefer bright, legible images or simple charts. Avoid text-dense screenshots.
- For video, front-load value in the first 1–2 seconds.
- Write clear alt text
- Improves accessibility and can aid understanding in low-bandwidth or preview contexts.
- Post at audience peak times
- Check your analytics for hourly engagement patterns. Test weekday mornings vs. afternoons for your niche.
- Leverage threads
- Use 3–7 Tweet threads to teach, narrate, or break down a process. Each tweet creates another impression opportunity.
- Quote and participate in timely conversations
- Add original analysis to trending topics within your domain. Avoid low-value “me-too” quotes.
- Use 1–2 relevant hashtags
- Choose precise tags rather than generic ones. Over-tagging hurts readability.
- Cross-boost with replies
- Reply to your own Tweet with additional context or a resource to extend on-feed life.
- Collaborate
- Co-create threads or host Spaces with adjacent creators. Mutual mentions multiply impressions.
- Prune and iterate via A/B tests
- Test hooks, image styles, and post times. After 2–3 cycles, drop the bottom performers and double down on winning patterns.
Bonus: Keep your profile optimized. A memorable display name, clear bio keywords, and a pinned Tweet with your best work increase profile visits and downstream impressions.
Common Misconceptions and FAQs
- Do my own views count?
- Your own account can generate impressions when your Tweet is served in your feeds or profile views. Analytics are not strictly “unique people”; some self-views may be filtered, but you should assume they can count.
- Do embedded Tweets count?
- Yes. When your Tweet is rendered in embedded timelines or as an embedded post on websites/apps, those can contribute to impressions.
- Will refreshing the feed inflate counts?
- Rapid refreshes and suspicious patterns are often throttled or filtered. Expect anti-gaming protection rather than linear growth from manual refreshes.
- Can protected accounts get impressions beyond followers?
- Protected Tweets are limited to approved followers. They won’t accrue impressions from non-followers or public embeds.
- Does deleting and reposting help?
- Only if the original post timing or hook was poor. Reposting resets engagement momentum and can fragment conversation. Prefer iterative improvements and quote-tweeting updated context.
- Why high engagement but modest impressions?
- Strong niche relevance to a smaller audience. The content resonates, but the initial seed or topic breadth is limited. Keep posting similar content to widen the engaged audience over time.
- Why high impressions but low engagement?
- Weak hook, low relevance, or a click-averse format (e.g., vague teaser). Tighten your first line and offer clearer value.
- Are “views” the same as attention?
- No. Impressions/views indicate delivery. To estimate attention, look at engagement rate, detail expands, video watch time, and link clicks.
Putting It All Together
Impressions tell you how often your Tweets are getting delivered; engagement tells you how compelling they are. To grow both:
- Publish consistently, at peak times.
- Lead with a strong hook and high-contrast media.
- Participate in timely, relevant conversations.
- Learn quickly with small, continuous A/B tests.
Track Tweet-level analytics weekly, export account-level data monthly, and compare like-for-like posts over similar windows. With steady iteration, your impression curve—and the business outcomes behind it—will follow.
Summary
Tweet impressions measure delivery, not attention, and they’re influenced by factors like audience activity, topical relevance, media, and early engagement. Use analytics to locate and interpret impressions, then iterate on hooks, visuals, timing, and conversation participation to increase distribution. Combine consistent posting with light testing and occasional paid boosts to compound growth over time.