What Are Twitter Impressions? A Clear Guide to X Analytics, Benchmarks, and Growth Tactics
Learn what Twitter impressions are, how X Analytics counts them, where to find them, differences vs reach and engagement, plus benchmarks and growth tactics.

Understanding how X (formerly Twitter) counts and displays impressions is essential for interpreting performance and making smarter content decisions. This guide explains what impressions are, where to find them, how they differ from reach and other metrics, and which tactics and measurement frameworks move the needle. Use it as a practical reference for benchmarks, reporting, and both organic and paid growth.
What Are Twitter Impressions? A Clear Guide to X Analytics, Benchmarks, and Growth Tactics

If you’re asking “what are twitter impressions,” here’s the short answer: impressions on X (formerly Twitter) count how many times a post was displayed on a screen. They are not unique users; the same person can account for multiple impressions if they see your post multiple times across surfaces.
How Impressions Are Counted
An impression is recorded when your post is rendered in any of these official placements:
- Home timeline (For You and Following)
- Search results and Trends modules
- Profile and post detail pages (including when people open your post)
- Lists, Communities, and Topics feeds
- Embedded posts on external sites when using X’s official embed (not screenshots)
- Ads placements if you’re running paid promotion
Notes:
- Organic vs. paid impressions: organic comes from unpaid distribution; paid comes from Ads. Together, they make total impressions. Ads Manager lets you break these out.
- Not unique: impressions measure exposures, not people. “Reach” in Ads attempts to deduplicate at the account level.
- Deleted/private posts stop accruing and may disappear from aggregate views.
- Definitions can evolve; always check the current X Ads and Analytics documentation if you need strict compliance.
Where to Find Your Impressions on X
- Post detail (mobile and desktop):
- Open your post and tap/click “View post analytics.”
- You’ll see Impressions, Engagements, and other interactions.
- X Analytics dashboard:
- Navigate to your analytics dashboard to see daily/monthly impressions and top posts. Use date range selectors for 7, 28, or custom-day windows.
- Export CSV to analyze impressions per post, per day, and per follower.
- Ads Manager (for paid and organic breakdowns):
- Use Campaigns > Ad Groups > Ads to see impressions, reach, frequency, and more.
- Filter by objective, placement, device, creative, and geography.
- Export by date range (e.g., last 7 days vs. month-to-date) to isolate seasonality.
- Date-range tips:
- Compare equal-length periods (e.g., last 28 days vs. previous 28) for clean baselines.
- Exclude paid when assessing organic momentum, then add paid back to quantify lift.
- Roll up weekly and monthly for executive reporting, daily for experimentation.
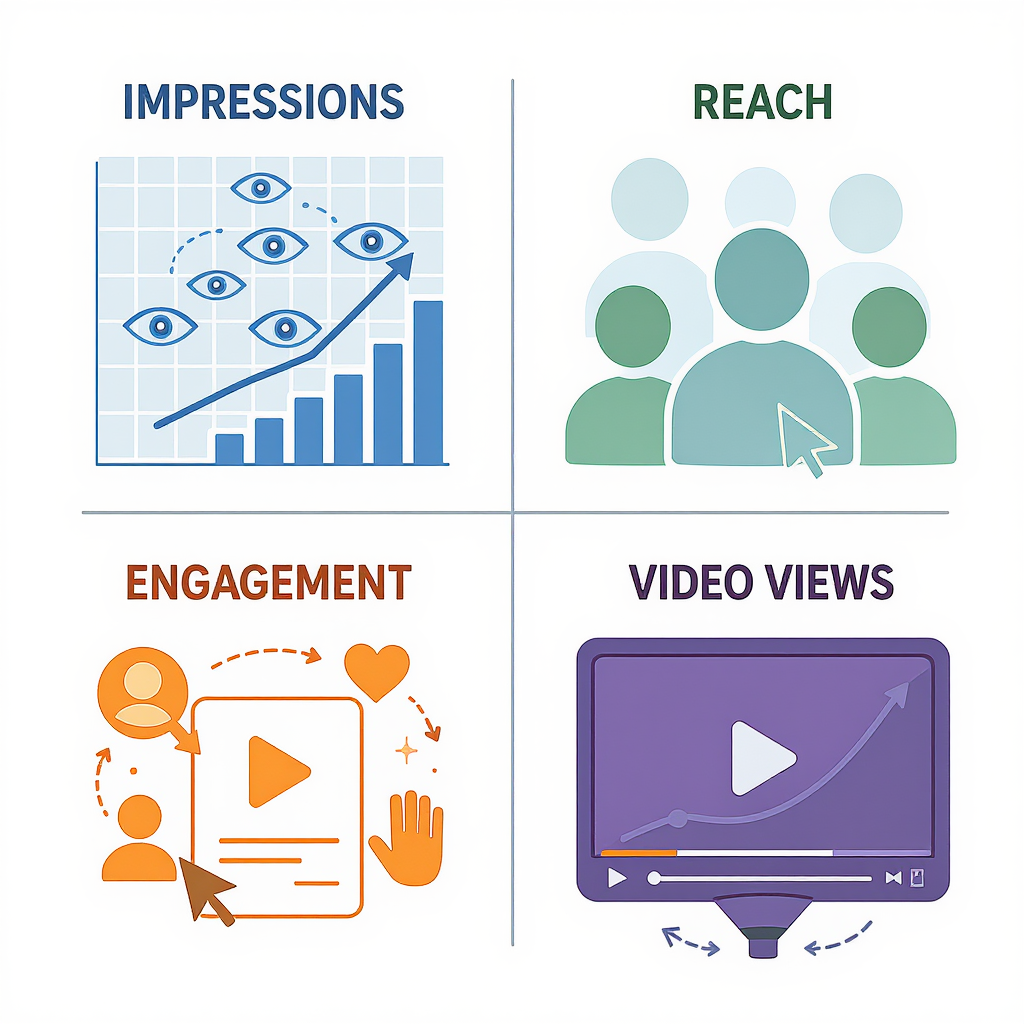
Impressions vs. Reach vs. Engagement vs. Video Views
Impressions and reach are often confused. Here’s how they differ and why it matters.
| Metric | Meaning | Where to Find | Typical Formula/Notes |
|---|---|---|---|
| Impressions | Total times your post was displayed (not unique). | Post analytics, X Analytics, Ads Manager. | Sum of organic + paid impressions across placements. |
| Reach (Ads) | Estimated unique accounts served. | Ads Manager (campaign-level and below). | Deduplicated; pair with frequency = impressions ÷ reach. |
| Engagements | Total interactions (likes, replies, reposts, profile/link/media clicks, etc.). | Post analytics, X Analytics, Ads Manager. | Engagement rate = engagements ÷ impressions. |
| Video Views | Counts when a viewer watches for a minimal threshold. | Post analytics, Ads Manager (video objectives). | Typically ≥ ~2s with ≥50% in view or tap-to-play; check current spec. |
| Link CTR | Click-through rate to a URL. | Post analytics, Ads Manager; validate with web analytics. | CTR (imp-based) = link clicks ÷ impressions. |
Quick formulas you’ll use often:
Engagement rate = total engagements / impressions
Frequency (Ads) = impressions / reach
CTR (impression-based) = link clicks / impressions
Impressions per follower = impressions / follower count
Impressions per hour = impressions / hours since post
How Impressions Are Generated
X’s distribution blends algorithms and network effects:
- Relevance: Prior engagement with you and similar topics, language, and user interests.
- Recency: Fresh posts are favored; momentum in early minutes can snowball.
- Relationships: Mutual follows, replies, DMs, and profile visits signal affinity.
- Follower graph effects: More followers can mean more baseline exposures, but quality of followers (active, relevant) matters more than raw count.
- Retweets and Quotes: Reposts extend reach into secondary networks, compounding impressions.
- Hashtags and keywords: Useful for discovery if they match active conversations; use sparingly and precisely.
- Media types: Native images and videos often earn more surface area and interactions, lifting impressions.
- Threads: Multi-part posts can keep people engaged longer, generating iterative impressions on each tweet.
- Replies: Early and relevant replies to larger accounts can earn impressions from their audience and seed your own post’s momentum.
Benchmarks and Context: Set the Right Expectations
There’s no universal “good” number—context rules:
- Audience size and niche: Smaller, passionate niches can outperform broad, noisy ones.
- Content type: Tutorials and how-tos often have higher engagement rates; announcements may have high impressions but lower interaction density.
- Account maturity: Newer accounts may see volatility; stability grows with consistent posting.
- Practical relative metrics:
- Impressions per follower per post: 0.2x–1.5x is a common range; smaller, highly engaged accounts can exceed 1.5x.
- Engagement rate: 0.5%–2% is a typical baseline; strong posts can exceed 5%.
- Avoid vanity traps:
- Raw impressions without downstream results (clicks, signups, replies) can mislead.
- Always pair impressions with a quality signal (ER, CTR, saves, follows).
Tactics to Grow Impressions (Without Being Spammy)
- Timing and cadence:
- Post when your audience is online; test 2–4 slots/day across time zones.
- Maintain a steady cadence (e.g., 1–2 strong posts/day + 3–5 thoughtful replies).
- Compelling hooks:
- Lead with a question, tension, or clear benefit in the first 1–2 lines.
- Front-load keywords people care about.
- Visuals and accessibility:
- Use crisp images or short native videos; test 1:1 and 16:9 crops.
- Add alt text to improve accessibility and potential search indexing.
- Trend participation:
- Join conversations early with substance, not just hashtags.
- Quote-tweet with analysis instead of reposting alone.
- Strategic hashtags:
- 1–2 relevant tags outperform tag stuffing; place at the end.
- Reply-first strategy:
- Add insightful replies to high-velocity posts in your niche within minutes of posting.
- Leverage quotes and reposts:
- Quote your own best posts with updates or data; repost top-performing evergreen content on a schedule.
- Communities, Topics, and Lists:
- Share into Communities that fit; curate Lists to monitor and reply to relevant accounts quickly.
- Cross-promotion:
- Tease threads in your newsletter, blog, or other socials; embed posts in articles.
Paid vs. Organic Interplay
Using ads smartly can amplify organic distribution:
- Seed momentum:
- Run small reach/engagement bursts in the first 60–180 minutes to gather social proof.
- Targeting hygiene:
- Use tight interest/keyword targeting and exclude low-quality placements if needed.
- Build custom audiences (site visitors, video engagers) and lookalikes.
- Frequency caps:
- Manage ad fatigue; aim for reasonable frequency (e.g., 1–3/day per user) depending on goal.
- Creative rotation:
- Refresh hooks and visuals weekly to prevent burnout and keep CTR healthy.
- Measure halo:
- Track organic impressions for posts with and without paid seeding to estimate lift.
Measurement Frameworks That Keep You Honest
- A/B testing:
- Test hooks, media types, length, and posting times.
- Hold variables constant; run enough iterations to reach directional confidence.
- UTM tagging:
- Tag links so downstream traffic shows up in web analytics segmented by post/variant.
https://example.com/landing?utm_source=x&utm_medium=social&utm_campaign=thread_launch&utm_content=hookA_imgExample experiment log (CSV-style):
date,post_type,hook,media,time,impressions,engagements,link_clicks
2025-09-01,Single,Question,Image,09:00,12450,310,122
2025-09-01,Single,Statement,Text,13:00,8350,97,41
2025-09-02,Thread,How-to,Video,10:30,26400,910,388
Common Pitfalls and FAQs
- Do embedded posts count toward impressions?
- Yes, when rendered via the official embed code. Screenshots do not.
- Are bot/low-quality views included?
- X combats spam, but some low-quality impressions may exist. Focus on rate metrics and downstream results.
- Why are my impressions dropping?
- Seasonality, post mix, overposting, creative fatigue, or audience shifts. Audit timing, hooks, and media.
- What about deleted or private content?
- Deleted posts stop counting; private (protected) accounts limit visibility to approved followers.
- Regional visibility:
- Localized trends, languages, and content policies can affect distribution.
- “Views” vs. “Impressions” after the rebrand:
- Public counters often say “Views” on posts; in analytics, these correspond to “Impressions.” Video views are a separate metric with different counting rules.
Reporting Template (Monthly Snapshot)
Use this lightweight structure to summarize performance and guide decisions.
| Month | Total Posts | Total Impressions | Impressions/Post | Followers (EOM) | Impressions/Follower | Engagements | Engagement Rate | Link Clicks | CTR | Video Views | Top Impression Drivers |
|---|---|---|---|---|---|---|---|---|---|---|---|
| 2025-08 | 62 | 842,000 | 13,580 | 18,900 | 0.72 | 12,640 | 1.50% | 3,910 | 0.46% | 88,400 | Threads, early replies, how-tos |
Narrative checklist:
- What changed vs. last month (content mix, timing, paid support)
- Top 3 posts by impressions and why they worked
- Experiments run and outcomes (hook tests, media tests, timing)
- Insights (e.g., “tutorial threads + native video lifted impressions/post by 32%”)
- Next steps (double down on winners, retire underperformers, new tests to run)
Template formulas to keep handy:
Impressions per post = total impressions / total posts
Impressions per follower = total impressions / followers (EOM)
Engagement rate = total engagements / total impressions
CTR = link clicks / impressions
Final Takeaway
Impressions tell you how often your posts are seen; they’re the starting line, not the finish. Pair them with engagement, CTR, and clear goals. Use smart experimentation, clean measurement, and a mix of organic tactics plus judicious paid seeding to compound visibility over time. When you ask “what are twitter impressions,” remember: they’re the exposure that your strategy turns into outcomes.