What Does Accounts Reached Mean on Instagram? A Clear Guide to Reach, Impressions, and Growth
Learn what Accounts Reached means on Instagram, where to find it in Insights, how it differs from impressions and engagement, and practical steps to grow reach.
Understanding Instagram’s “Accounts Reached” metric is essential for measuring how widely your content is being seen. This guide clarifies where to find reach, how it’s calculated, how it differs from impressions and engagement, and the steps you can take to grow it. Use the sections below as a reference to diagnose performance, set practical benchmarks, and troubleshoot fluctuations over time.
What Does “Accounts Reached” Mean on Instagram? A Clear Guide to Reach, Impressions, and Growth

If you’re wondering “what does accounts reached mean on instagram,” here’s the simple answer: Accounts Reached is the number of unique Instagram accounts that saw your content within a selected time frame or for a specific post. It reflects exposure—how many different people you got in front of—not repeat views and not interactions.
Below is a practical, data-informed guide to where to find reach, how Instagram counts it, how it differs from impressions and engagement, and how to grow it sustainably.
Definition in Plain English
- Accounts Reached = unique viewers. Each account is counted once per time window (account-level) or once per content item (post-level).
- It tracks exposure, not interaction. A reach count doesn’t mean those people liked, commented, or followed—only that the content appeared on their screen.
- It excludes repeat views by the same account within the same context. Multiple views by the same person don’t increase reach; they increase impressions or watch-time.
- It can include both organic and paid distribution. Instagram will show splits where available.
Where to Find Reach in the App
You’ll need a professional account (Creator or Business). Switching is free and doesn’t change your followers.
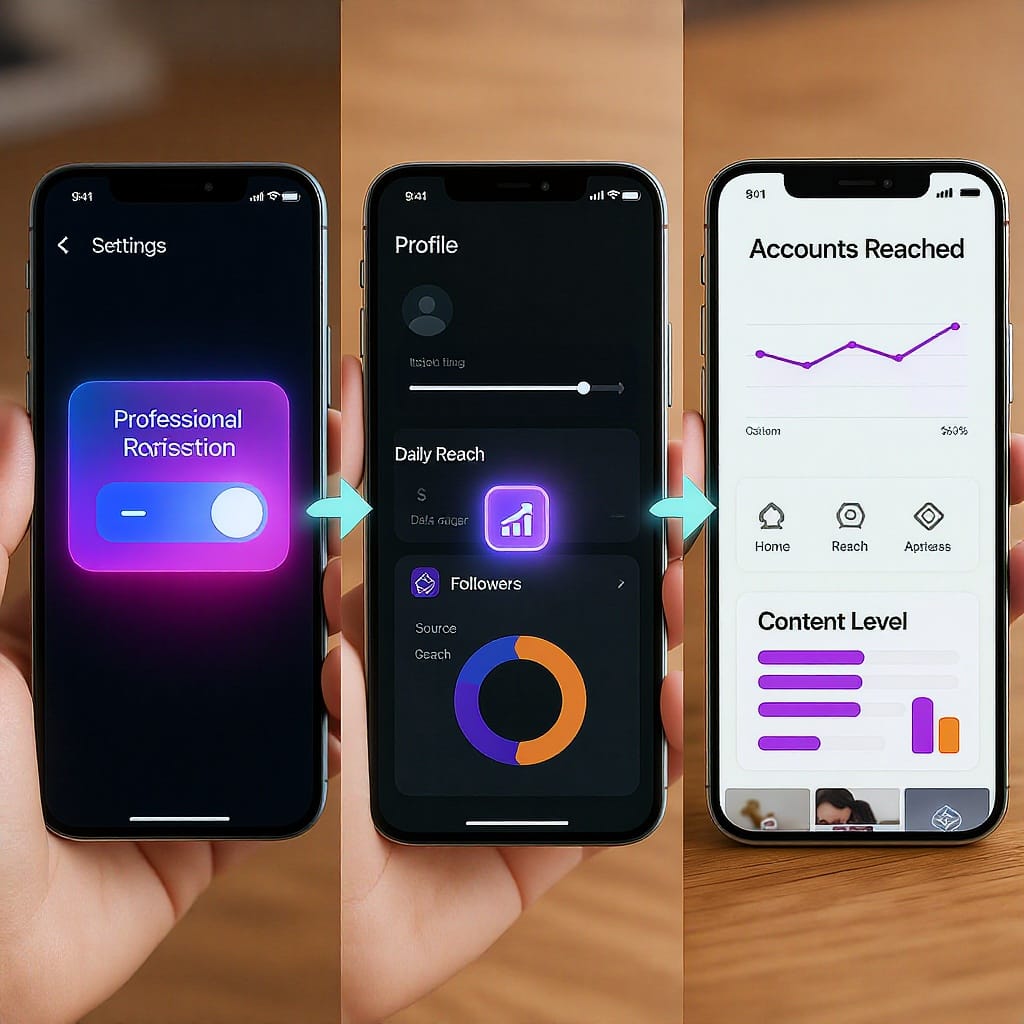
Turn on a Professional Account
- Go to your profile > Settings & privacy > Account type and tools.
- Tap Switch to professional account and choose Creator or Business.
View Account-Level Reach (Custom Ranges)
- Go to your profile and tap Insights.
- At the top, select a date range (Last 7 days, 30 days, 90 days, or Custom).
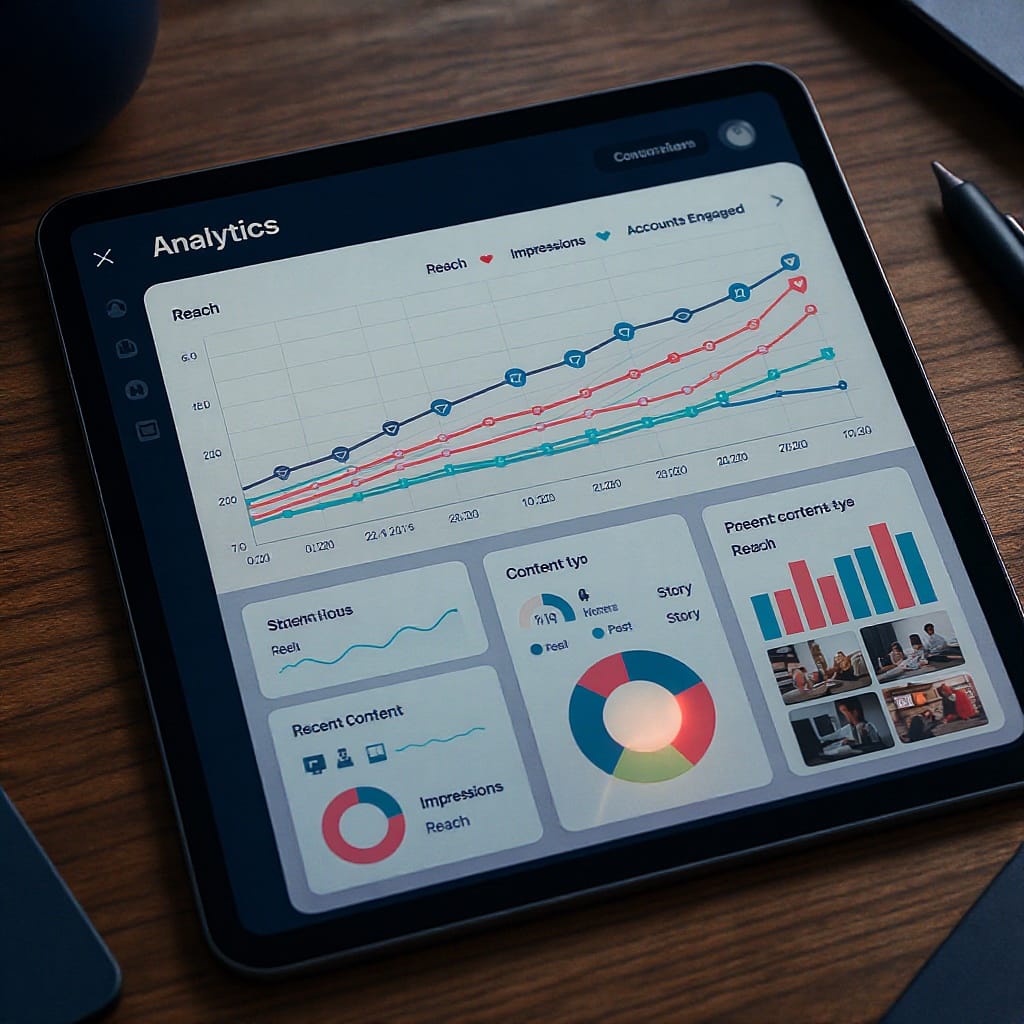
- Look for the “Accounts reached” card. Tap to open details:
- Followers vs Non-followers reached
- Content type contribution (Reels, Posts, Stories, Live)
- Top cities/countries and age/gender (aggregated)
- Organic vs Paid (if you ran promotions/ads)
View Content-Level Reach
- Posts and Carousels: Open a post > View insights > “Accounts reached.”
- Reels: Open a reel > View insights > “Reached accounts,” plus “Followers vs Non-followers” and watch-time metrics.
- Stories: Open a live or expired story from the archive > Insights for that story > “Accounts reached,” taps, exits.
- Lives: After a Live ends, review “Accounts reached,” peak concurrent viewers, and replays.
Tip: The Insights interface evolves. Names and placements may vary slightly across regions and app versions.
How Instagram Counts Reach
- Unique-user counting: At the account level, each account is counted once per selected date range, regardless of how many posts they saw. At the content level, each account is counted once per content item.
- Time-window nuances: If you choose a 30-day range, someone who saw you on Day 1 and Day 29 is still one reached account for that range.
- Aggregation vs. per-content: Account-level reach deduplicates across all your content. Post-level reach does not deduplicate across different posts.
- Estimated metrics and stabilization: Reach is an estimate and may adjust as systems deduplicate, filter spam, or finalize eligibility. Expect minor fluctuations for 24–72 hours after posting.
- Organic vs paid labeling: If you boosted a post or ran ads, insights often show the split. Totals can shift slightly as paid reporting syncs.
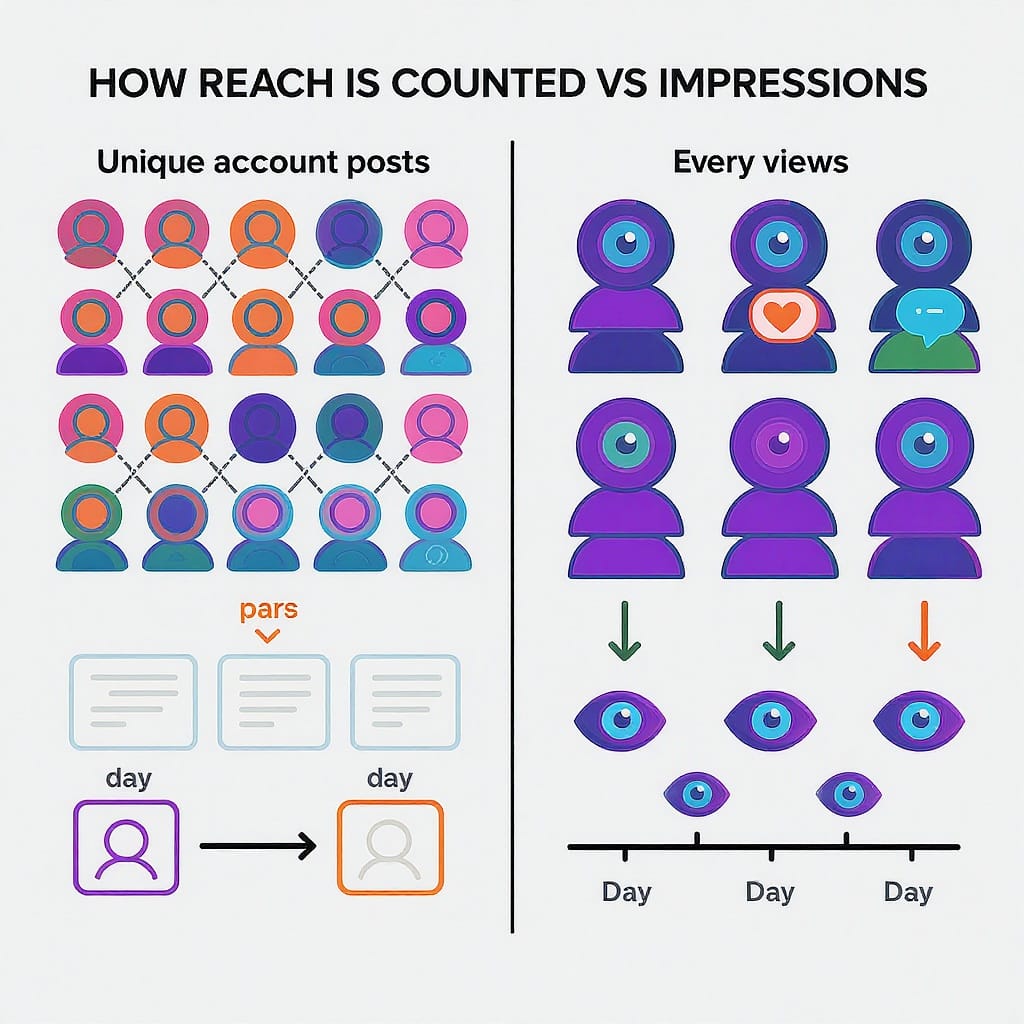
Reach vs Impressions vs Accounts Engaged
To diagnose performance, you need all three concepts. Here’s how they differ and relate:
| Metric | What It Measures | Can Be Higher Than Reach? | What It Tells You | Common Uses |
|---|---|---|---|---|
| Accounts Reached | Unique accounts that saw your content | — | How many different people you exposed content to | Awareness, top-of-funnel size, discovery |
| Impressions | Total times content was displayed (including repeats) | Yes | Depth of exposure and frequency among viewers | Frequency, saturation, creative fatigue checks |
| Accounts Engaged | Unique accounts that interacted (likes, comments, shares, saves, taps) | — | Quality of attention: who did something | Content resonance, conversion propensity |
Key takeaways:
- Impressions can exceed reach because the same person can see your content multiple times across surfaces.
- Accounts Engaged is a subset of Accounts Reached. Engagement rate on reach = engaged / reached.
- When diagnosing performance:
- Low reach + strong engagement rate often means great content but limited distribution.
- High reach + low engagement rate can signal weak relevance or misaligned audience.
Surfaces and Sources of Reach
Instagram distributes content across several surfaces and discovery paths:
- Surfaces:
- Feed: Your followers’ home feed and following tab.
- Stories: 24-hour stories row; also story highlights.
- Reels: Full-screen, recommendation-heavy feed with strong non-follower distribution.
- Live: Real-time video with notifications and later replays.
- Sources:
- Home (Feed)
- Explore
- Hashtags (mainly for posts; limited for reels)
- Profile visits
- Shares (DMs, Stories)
- Audio pages (for reels using trending sounds)
- Recommendations (feed/reels suggestions to non-followers)
Different surfaces behave differently:
- Reels tend to deliver higher non-follower reach if watch-time and completion are strong.
- Stories skew toward followers, but shares and mentions can extend reach.
- Feed posts can reach followers reliably; Carousels often increase dwell-time and subsequent distribution.
| Surface | Typical Audience Mix | Primary Performance Drivers | Notes |
|---|---|---|---|
| Reels | High non-follower potential | Hook, retention, re-watches, shares | Best for discovery when content is watchable and shareable |
| Feed Posts | Follower-heavy, some non-follower via Explore | Dwell-time, saves, shares, comments | Carousels increase time spent and signal quality |
| Stories | Mostly followers | Replies, sticker taps, completion rate | Great for nurturing, less for mass discovery |
| Live | Followers + notifications reach | Concurrent viewers, retention, replays | Co-hosting expands reach to both audiences |
Why Reach Matters (and Realistic Benchmarks)
- Awareness and top-of-funnel growth: Reach tells you whether you’re consistently appearing in front of new people.
- Follower vs non-follower split: A higher share of non-follower reach indicates discovery momentum.
- Trend lines > one-size-fits-all: Niches, geographies, and content formats differ. Watch your week-over-week and month-over-month changes rather than chasing universal benchmarks.
- Ratios to monitor:
- Reach as a percentage of followers (e.g., weekly reach / followers)
- Non-follower reach share on reels
- Engagement rate on reach (accounts engaged / accounts reached)
Proven Ways to Increase Accounts Reached Organically
- Start with thumb-stopping hooks:
- Reels: Visual motion in the first 2 seconds, pattern interrupts, bold on-screen promise.
- Feed: Compelling first slide on carousels; strong headline text.
- Max out retention:
- Tight edits, fast cuts, remove dead air.
- Visual cues, captions/subtitles, pacing that rewards completion.
- Encourage swipes and shares:
- Carousels that unfold a story or framework.
- “Send to a friend who needs this” or “Save for later” prompts when relevant.
- Post when your audience is active:
- Use Insights to find top active times and test variations.
- Write meaningful captions:
- Add context, value, or a mini-narrative; front-load the hook.
- Use relevant hashtags and topics:
- Choose specific, niche-relevant tags; avoid spammy lists.
- Collaborate:
- Use Collab posts/reels to publish to two profiles at once.
- Co-create with complementary creators/brands to tap new audiences.
- Make sharing effortless:
- Add on-screen titles and subtitles so content is understandable muted and out of context.
Optimization Specifics by Format
Reels
- Hook in first 2 seconds: motion, promise, or surprising visual.
- Maintain watch-time: 90–120% average watch time on shorter reels can signal strong quality; replays matter.
- Use native text and captions: easy to read, avoids cropping.
- Keep aspect ratio vertical (9:16) and avoid heavy borders.
- Test lengths (7–15s vs 20–35s) to find your retention sweet spot.
- Leverage trends judiciously: align with your niche, don’t force it.
Stories
- Interactive stickers: polls, quizzes, sliders increase taps and completion.
- Link stickers: drive traffic without losing too much retention; keep it concise.
- Frequency and sequencing: batch 3–7 frames per drop; keep narrative flow.
- Reshares and mentions: encourage UGC and reshares to reach adjacent audiences.
Feed Posts
- Carousels: lead with the payoff, then steps or detail slides.
- Saves and shares: actionable tips, checklists, and templates encourage both.
- Alt text and accessibility: helps clarity and can support comprehension across contexts.
Live
- Co-hosts and guest creators: double the potential audience.
- Announce ahead: reminders via countdown sticker or scheduled Live.
- Repurpose: clip highlights into reels and stories to extend reach.
Paid Reach Without Waste
- Boost vs Ads Manager:
- Boost is fine for quick amplification of a strong organic post to broad audiences.
- Ads Manager gives you full control over objectives, placements, frequency, and split tests.
- Choose the right objective:
- Reach or Brand Awareness when the goal is pure exposure.
- Use frequency caps to avoid fatigue (e.g., 1–2 impressions per 7 days for broad reach).
- Creative variants:
- Rotate 3–5 variants to control frequency and avoid creative burnout.
- Audience breadth:
- Broad targeting with platform recommendations can outperform overly narrow interests.
- Use location and language filters as needed; avoid stacking too many interests.
- Separate prospecting from retargeting:
- Prospecting for net-new reach.
- Retargeting to re-engage engagers or site visitors with different creative and frequency.
Troubleshooting Dips and Spikes
Common causes:
- Seasonality and events: Holidays, major news, or sports can suppress or skew reach.
- Content mix shifts: More stories vs reels can reduce non-follower reach.
- Limited distribution: Weak early retention or engagement can cap recommendations.
- Over-posting or under-posting: Either can reduce average post quality signals.
- Music/region restrictions: Audio limitations can restrict distribution in some countries.
- Account status: Policy violations or IP issues can quietly dampen reach; check Account Status in settings.
- Reporting delays: Short-term dips may be data sync artifacts; wait 24–72 hours.
Run simple A/B tests:
- One variable at a time: Hook style, length, caption CTA, posting time.
- Matched pairs: Post two similar reels one week apart with only one change.
- Minimum sample: Test across 3–5 posts before concluding.
- Evaluate on blended KPIs: Reach, non-follower share, watch-time, and engagement on reach.
Diagnostic checklist:
- Did average watch-time or completion drop?
- Did follower vs non-follower mix change materially?
- Did posting time slide outside your audience’s active window?
- Are you repeating a creative too often (creative fatigue)?
- Any policy warnings or music changes?
Practical Benchmarks to Track Over Time
- Weekly unique reach / followers: Is this ratio stable or improving?
- Non-follower reach share on reels: Trending up suggests discovery gains.
- Engagement rate on reach: Are more viewers taking action?
- Share and save rates: Often predictive of extended distribution.
Key Takeaways
- Accounts Reached measures unique viewers, not repeat views or interactions.
- Find it in Insights at both account and content levels; look at splits (followers vs non-followers, organic vs paid).
- Expect minor reporting adjustments as data finalizes.
- Use reach with impressions and engagement to understand both breadth and depth.
- Grow reach by optimizing hooks and retention, leaning into the right formats, collaborating, and layering paid reach thoughtfully.
- When performance shifts, A/B test systematically to isolate causes.
By focusing on consistent, high-retention content and watching your trend lines, you’ll turn “accounts reached” from a mysterious number into a reliable compass for Instagram growth.
Summary
- Accounts Reached shows how many unique accounts saw your content; it’s about exposure, not interaction.
- Check Insights for account-level and content-level splits, and pair reach with impressions and engagement for a complete view.
- Improve reach by sharpening hooks, maximizing retention, posting at active times, collaborating, and using paid reach strategically.
- Track trend lines and run simple A/B tests to diagnose dips, avoid creative fatigue, and sustain discovery momentum.