What Does Impressions Mean on X Social Media Platform
Learn what impressions mean on X, how they're calculated, the difference between organic and paid views, and how to use them to boost content strategy.
Introduction to X Impressions and Analytics Terminology
In today’s fast-paced digital landscape, X — the platform formerly known as Twitter — remains a key hub for real-time conversations, breaking news, and audience engagement. One of the most important yet misunderstood metrics in X Analytics is impressions. If you’ve ever asked, “What does impressions mean on X?”, you’re not alone. Knowing exactly what impressions are, and how they compare to other metrics like reach, engagement, and clicks, is essential for optimizing your content strategy and measuring its success.

---
Definition of Impressions on X vs Other Social Metrics
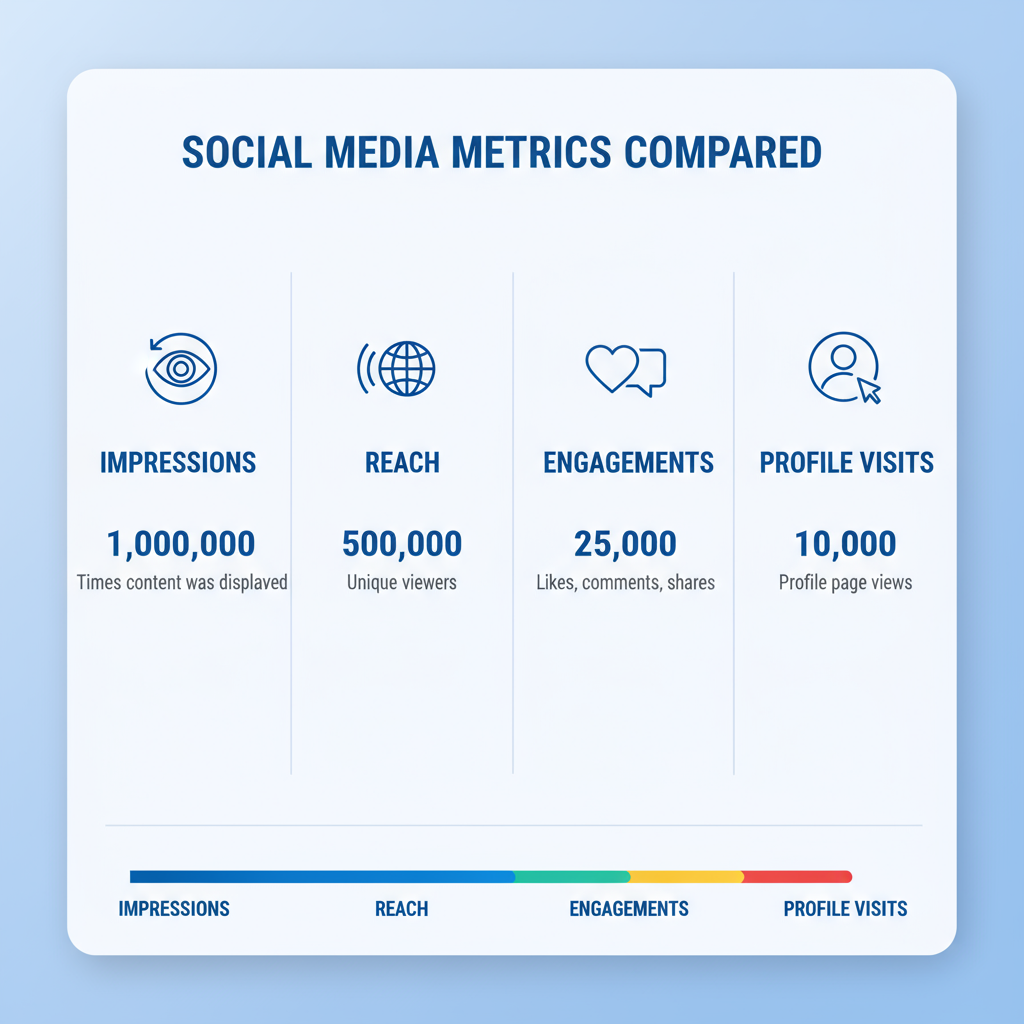
In simple terms, impressions on X are the total number of times your post is displayed on a user’s device — regardless of whether the user interacted with it.
It’s important to differentiate impressions from similar metrics:
| Metric | Definition | Example |
|---|---|---|
| Impressions | Total number of times your content appears on screens | Tweet shown 500 times across timelines, searches, and profiles |
| Reach | Number of unique accounts that saw your content | 300 individual users viewed your tweet |
| Engagement | Total user interactions with your content | Clicks, likes, replies, retweets |
One user can generate multiple impressions if they encounter the same post more than once.
---
How Impressions Are Calculated on X
X records an impression every time your content is served on a user’s screen. This happens in several ways:
- Home Timeline: Appears in followers’ feeds.
- Retweets and Quotes: Shared content shown to a new audience.
- Search Results: Displayed when searches match your keywords.
- Profile Views: Visible when someone browses your timeline.
- Trending or Hashtag Pages: Found via aggregated topics.
Keep in mind, impressions accumulate whether the user actively reads your content or simply scrolls past it.
---
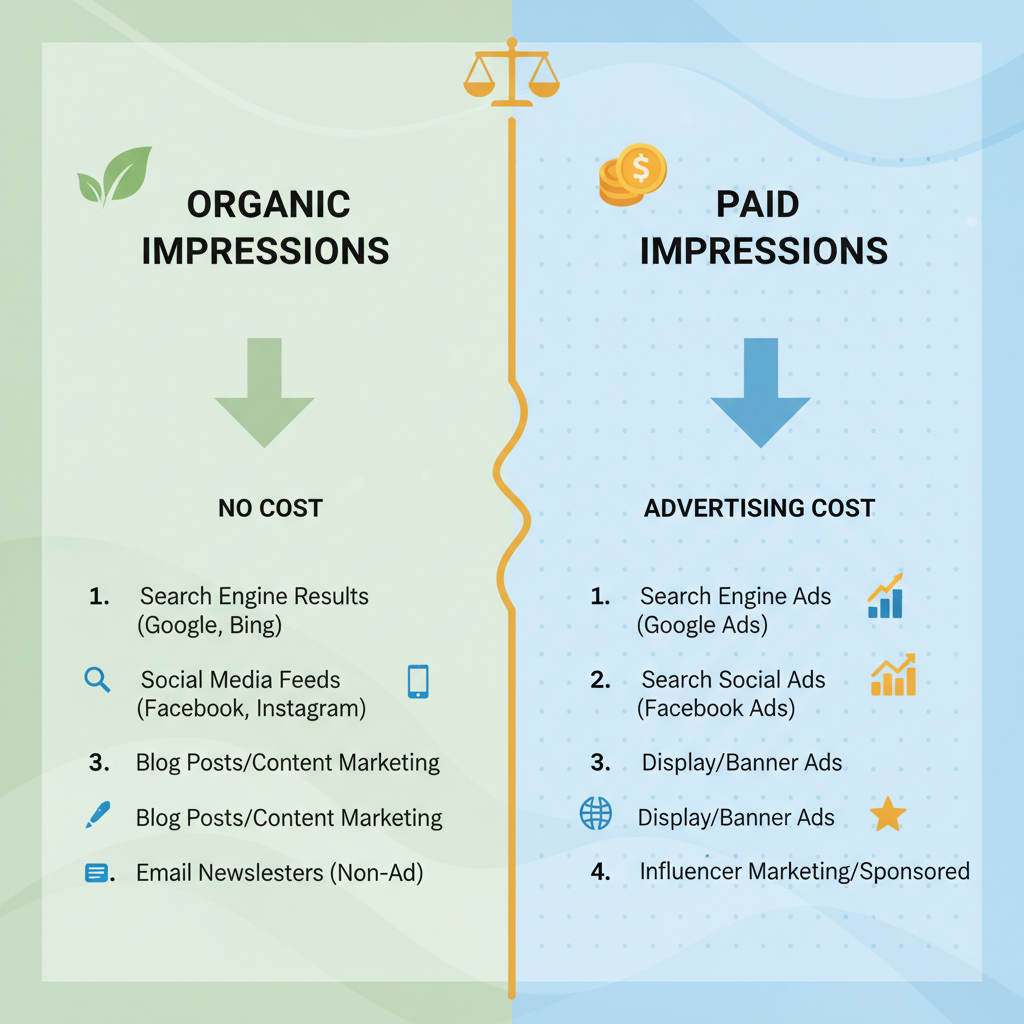
Organic Impressions vs Paid Impressions
On X, impressions are usually divided into two categories:
- Organic Impressions: Views generated without paid promotion. This includes followers seeing your post or others sharing it naturally.
- Paid Impressions: Views from promoted tweets or ads targeted to specific audience segments.
In X Analytics, these categories appear separately to help you evaluate campaign effectiveness.
---
Why Impressions Matter for Your Content Strategy
Though impressions don’t reflect engagement, they reveal how visible your posts are. High impressions can indicate:
- Greater brand exposure
- Higher potential for user interaction
- Effective post timing and hashtag use
- Insights into when and how your audience is active
If impressions decline, it may signal algorithm changes, reduced frequency, or less engaging formats.
---
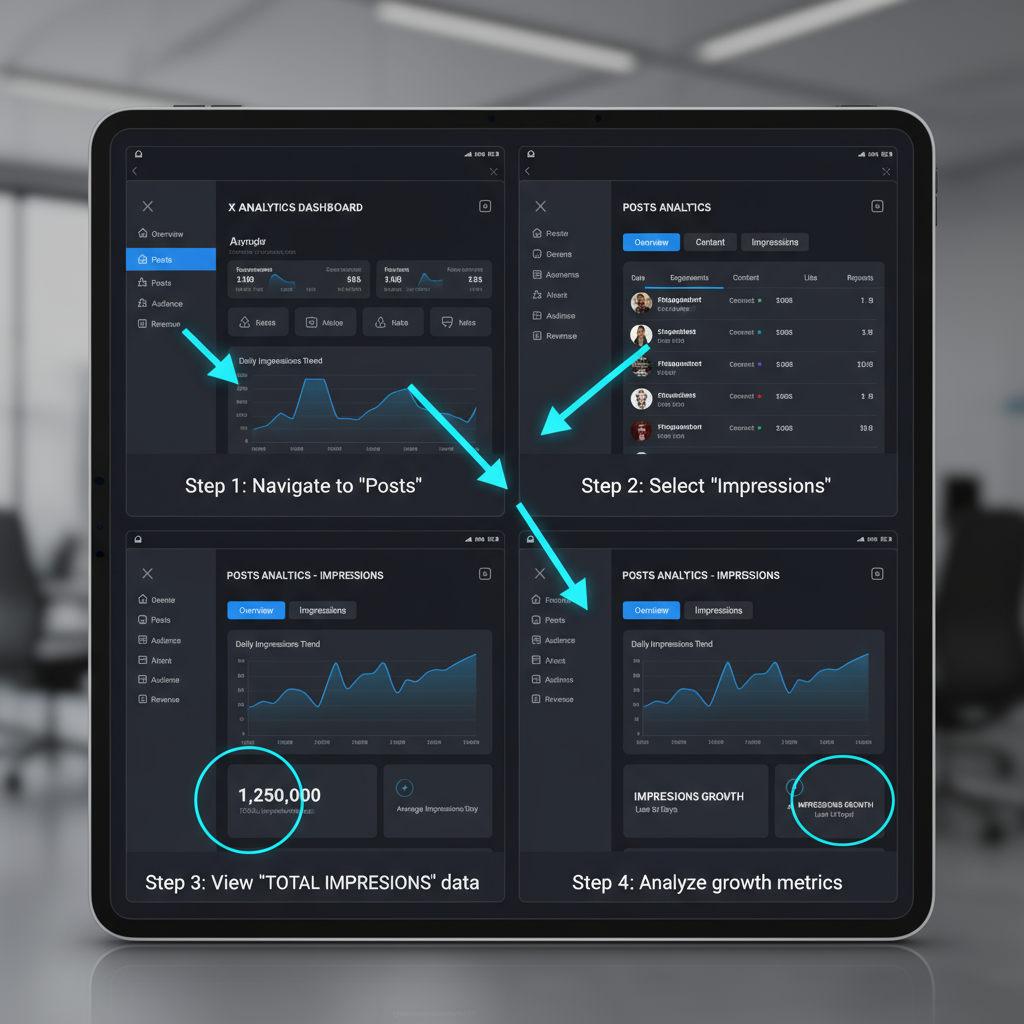
Where to Access Impression Data in X Analytics
Desktop:
- Log in to X.
- Click your profile icon → “Analytics” or go to `analytics.x.com`.
- Open the “Tweets” tab to see data like impressions, engagement rates, and total engagements.
Mobile App:
- Visit your profile and find the target tweet.
- Tap the analytics (bar chart) icon under the post.
- Review the full breakdown of metrics including impressions.
---
Tracking Impressions and Engagement Rate Together
Looking at impressions in isolation can give a partial picture. A tweet with 10,000 impressions but only 10 engagements suggests low engagement rate.
Engagement Rate Formula:
Engagement Rate (%) = (Total Engagements / Total Impressions) x 100Monitoring both impressions and engagement rate allows you to assess not only visibility but also content appeal.
---
Common Misconceptions About Impressions on X
- Not the Same as Clicks: Display ≠ click.
- No Direct Link to Conversions: High visibility doesn’t guarantee sales or sign-ups.
- Repeated Views Count: The same user seeing a post multiple times increases the impression total.
---
Tips to Increase Impressions on X
Practical ways to boost your visibility include:
- Post When Your Audience is Active: Use analytics to find peak times.
- Use Targeted Hashtags: Boost discoverability.
- Add Engaging Visuals: Images, GIFs, and videos draw attention.
- Create Threads: Encourages extended user interaction.
- Prompt Retweets and Shares: Expands reach beyond followers.
- Leverage Trends: Connect content to current topics.
---
Case Study: Boosting Impressions Through Strategy
Scenario:
A small e-commerce brand averaged 2,000 impressions per post over a 30-day period. After analyzing analytics, they implemented a refined strategy:
Key Changes:
- Posted during identified peak times
- Added two relevant hashtags per tweet
- Featured custom product images
- Responded quickly to comments to boost algorithmic visibility
Results After 30 Days:
| Metric | Before | After | Change |
|---|---|---|---|
| Average Impressions | 2,000 | 5,500 | +175% |
| Engagement Rate | 1.2% | 2.8% | +133% |
---
Limitations of Using Impressions Alone
While impressions track visibility, they don’t confirm audience attention or action. Over-reliance can lead to “vanity metric” pitfalls.
Combine impression tracking with:
- Click-through rates (CTR)
- Conversion goals
- Sentiment analysis
This ensures a holistic performance view.
---
Conclusion: Using Impressions to Inform Wider KPIs
An impression on X simply reflects how often your content is displayed. It’s a valuable top-of-funnel metric, but should be analyzed alongside engagement, clicks, CTR, and conversion rates for actionable insight.
By balancing volume (impressions) with impact (engagement and results), you can better tune your content calendar, target the right audience, and grow your influence on X. Whether organic or paid, impressions serve as an early signal of reach potential — a metric to watch, but never in isolation.
Ready to take your X Analytics to the next level? Start by reviewing your latest posts, comparing impressions with engagement rates, and refining your posting strategy for measurable growth.