What Does Insights Mean on Instagram and How to Use It
Learn what Instagram Insights means, where to find it, and how to use its analytics to boost reach, engagement, and audience targeting effectively.

What Does Insights Mean on Instagram and How to Use It
Instagram has evolved into far more than a place to share photos. For creators, brands, and businesses, the platform now offers powerful analytics through Instagram Insights. If you’ve ever asked yourself what does insights mean on Instagram, this guide explains its meaning, where to find it, and how to leverage the data to grow your reach and engagement effectively.
---
What Are Instagram Insights?
Instagram Insights is a free, built-in analytics tool for Business and Creator accounts. It enables you to:
- Measure how your content performs
- Learn audience demographics and behaviors
- Track performance across posts, Stories, Reels, and Lives
- Base your strategy on real data instead of guesswork
Insights turn raw engagement figures into clear action points. Whether you’re an influencer seeking sponsorships, a small business driving sales, or a social media manager building awareness, the data helps fine-tune your content.
---
Where to Find Instagram Insights (Step-by-Step)
Before accessing Insights, switch to a Business or Creator account; personal accounts do not offer this feature.
Steps to access Instagram Insights:
- Open Instagram App on your mobile device.
- Go to your Profile (bottom right avatar).
- Tap the menu icon (☰) in the top right corner.
- Select Insights.
- View the dashboard showing key performance data.
You can also access Insights directly from specific posts, Stories, Reels, or Lives by tapping View Insights beneath the content.
---
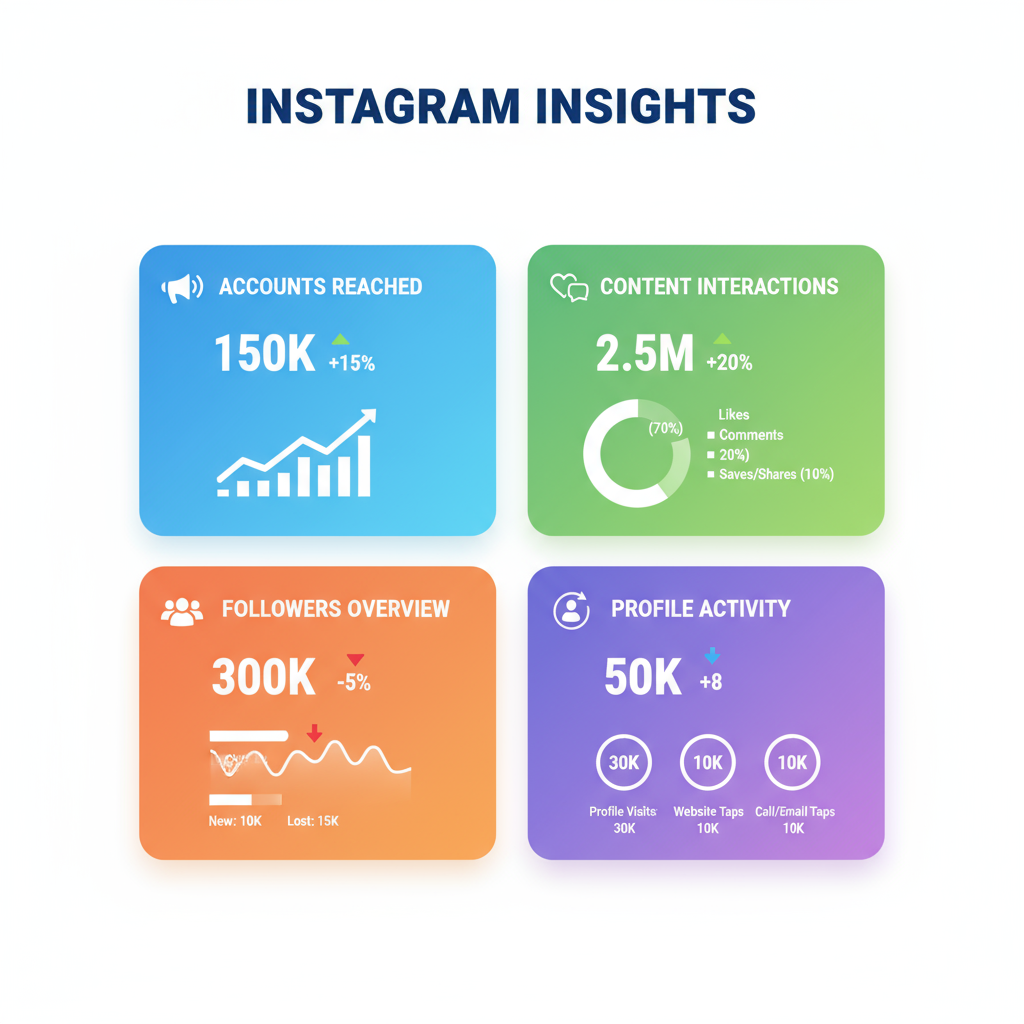
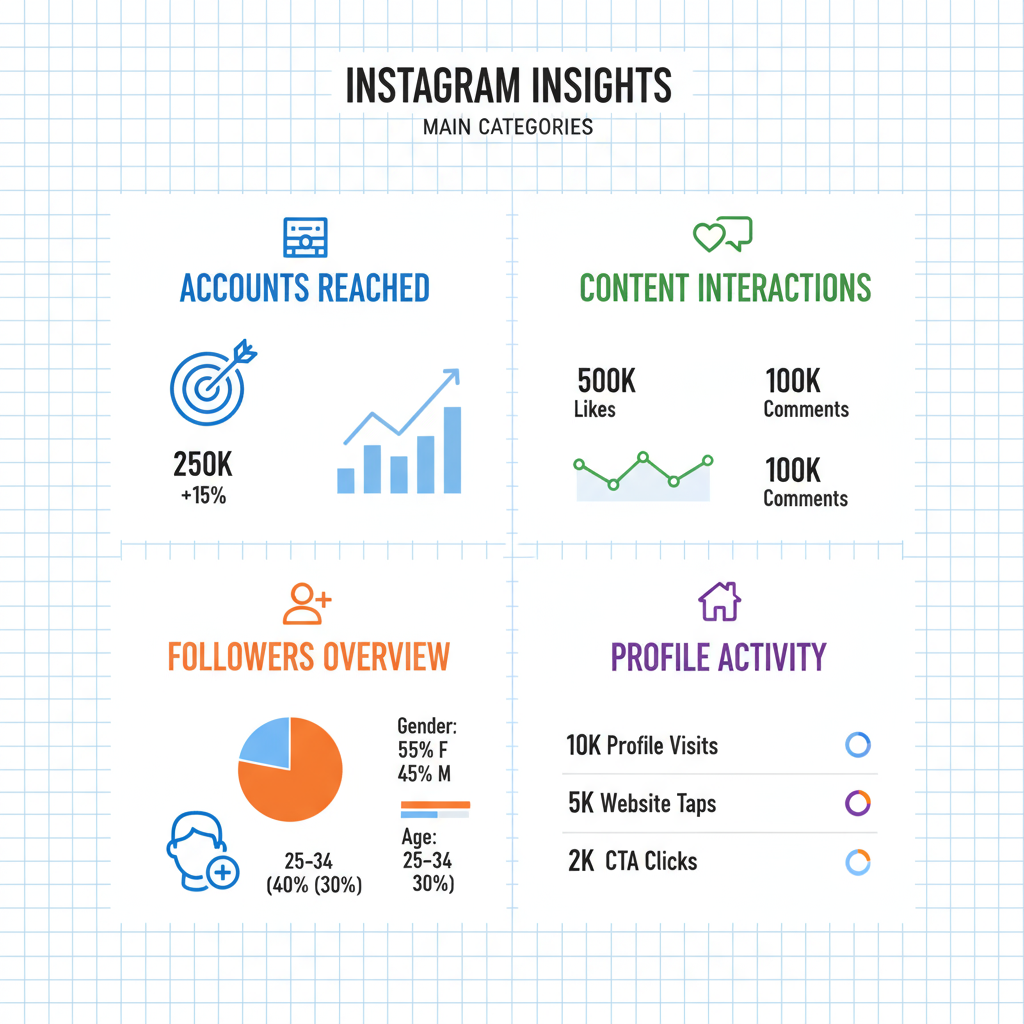
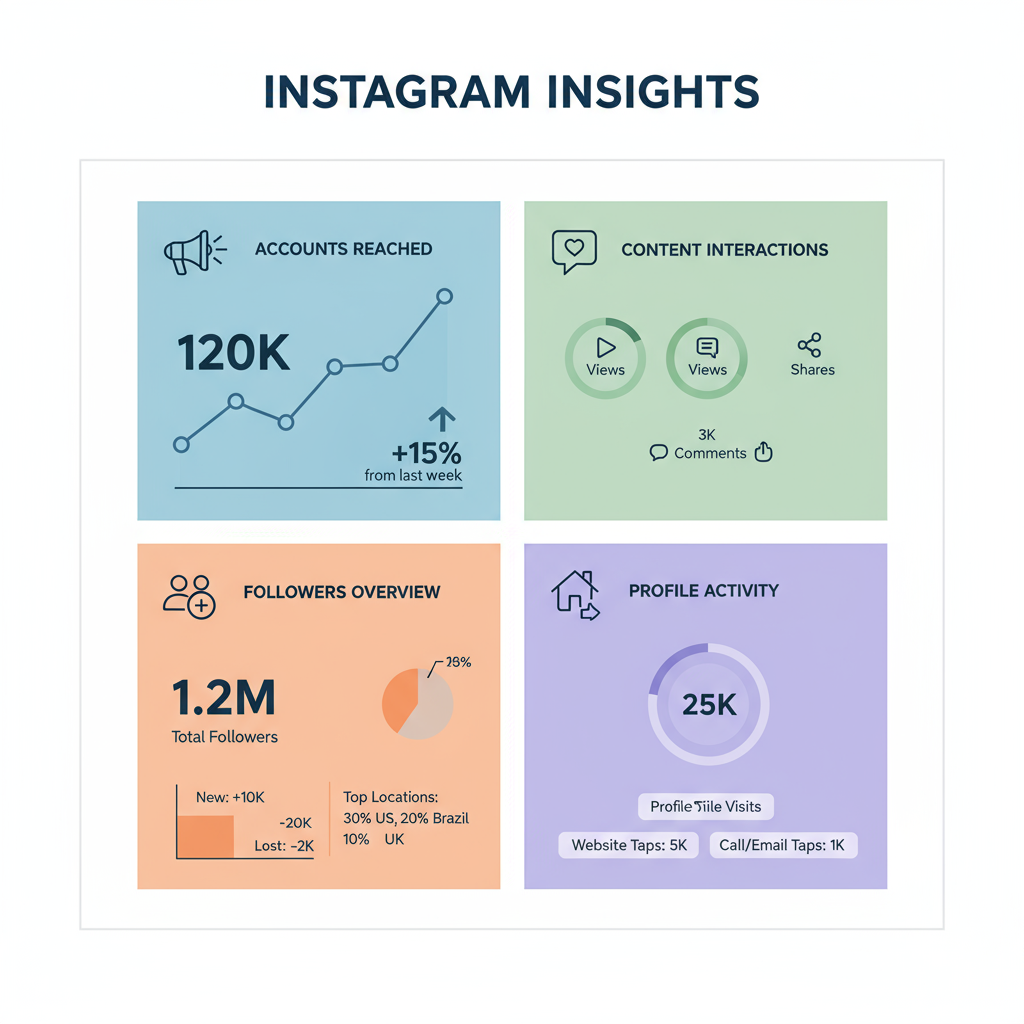
Breakdown of Key Metrics in Instagram Insights
Here’s an overview of the primary metrics you’ll see:
1. Accounts Reached
The number of unique accounts that have seen your content. Reflects reach, not repeated views.
2. Content Interactions
Counts engagement actions such as likes, comments, shares, and saves across all content types.
3. Followers Overview
Includes audience size, growth rates, and demographics like age, gender, and top locations.
4. Profile Activity
Shows profile visits, website link clicks, email taps, and other direct engagement actions.
---
Post, Story, Reel, and Live Insights
Each Instagram format has its own set of analytics:
| Content Type | Unique Metrics | Purpose |
|---|---|---|
| Post | Likes, comments, saves, shares, reach, impressions | Gauge interest in static or carousel photos/videos |
| Story | Exits, replies, next story taps, back taps | Monitor engagement and drop-off rates for short-term content |
| Reel | Plays, replays, shares, likes, comments | Measure virality potential through video-driven discovery |
| Live | Peak concurrent viewers, total viewers, comments | Track real-time engagement during broadcasts |
---
Reach vs. Impressions vs. Engagement
These three terms often cause confusion:
- Reach: Unique accounts that saw your content
- Impressions: Total times your content was displayed (including multiple views by the same person)
- Engagement: Interactions such as likes, shares, comments, and saves
Example: If one user views your Reel three times and likes it once:
- Reach: 1
- Impressions: 3
- Engagement: 1
---
Why Demographics Matter
Insights include audience data such as age, gender, location, and active times. This helps you:
- Target the right audience with relevant content and ads
- Adjust posting times to when your audience is most active
- Customize topics or formats based on cultural or regional interests
For example, if most followers live in one city, aligning posts with their timezone can improve real-time engagement.
---
Using Insights to Optimize Your Strategy
1. Posting Schedule
Check the Most Active Times in Followers data. Schedule posts within an hour before peak activity.
2. Content Types
Compare performance metrics between posts, Stories, and Reels, shifting focus to formats with higher engagement.
3. Experiment and Iterate
- Test different visual styles
- Change hashtag strategies and measure changes
- Review trends weekly and monthly for ongoing improvements
---
Case Study: Improving Engagement with Insights Data
Scenario: A clothing brand noticed via Insights that Reels got more interaction than image posts.
Action:
- Increased Reels from 1 to 3 per week
- Focused on styling tips and behind-the-scenes content
- Timed posts to match peak audience activity in the evenings
Results after 2 months:
- Reach up 45%
- Engagement rate up 60%
- Website clicks up 30%
---
Avoid These Common Mistakes
- Focusing on Vanity Metrics: Likes aren’t enough; focus on clicks, saves, and shares.
- Neglecting Audience Data: Posting at off-peak times can reduce reach.
- Short-Term Analysis: One week’s data can be misleading—track trends over months.
- Content Type Monotony: Over-reliance on one format can limit growth.
---
Tools & Tips for Tracking Long-Term Trends
While Instagram Insights is useful, pairing it with third-party tools enhances analysis:
- Meta Business Suite: Manage posting schedules and cross-platform analytics.
- Later or Buffer: Analyze trends and identify best posting times.
- Google Sheets: Export and track data to identify long-term patterns.
Pro Tip: Keep a monthly log of reach, impressions, top posts, and follower growth to track progress year-round.
---
Integrating Insights into Your Social Media Strategy
- Content Planning: Use top-performing formats as your content calendar base.
- Measure Campaigns: Match Insights data with conversion goals like sales or subscriptions.
- Apply Learnings Cross-Platform: Adapt Instagram trends for TikTok, Facebook, or YouTube.
- Refine Paid Ads: Target ads to demographics with high organic engagement.
---
Final Thoughts
Grasping what does insights mean on Instagram is essential for turning data into a growth engine. With careful analysis and regular strategy adjustments, Instagram Insights offers a roadmap to better reach, higher engagement, and stronger audience relationships. Start reviewing your analytics today, and let the numbers guide your creative direction.
Ready to put your analytics into action? Open your Insights dashboard now and identify one change you can make this week based on the data you see.