Average LinkedIn Engagement Rates and How to Improve Them
Learn what a good LinkedIn engagement rate is, industry benchmarks, and proven strategies to boost your content performance and audience interaction.

Understanding LinkedIn Engagement Rates
LinkedIn engagement rate is one of the most important social media KPIs for professionals and brands aiming to grow their presence. It measures how effectively your LinkedIn content resonates with your audience by calculating the percentage of users who interact with your posts—through likes, comments, shares, and clicks—against the total impressions (how many times your post appears in feeds).
In this guide, we’ll break down what is a good engagement rate on LinkedIn, how it’s calculated, what benchmarks to aim for, and actionable tips to improve your performance.

---
How LinkedIn Calculates Engagement Rate
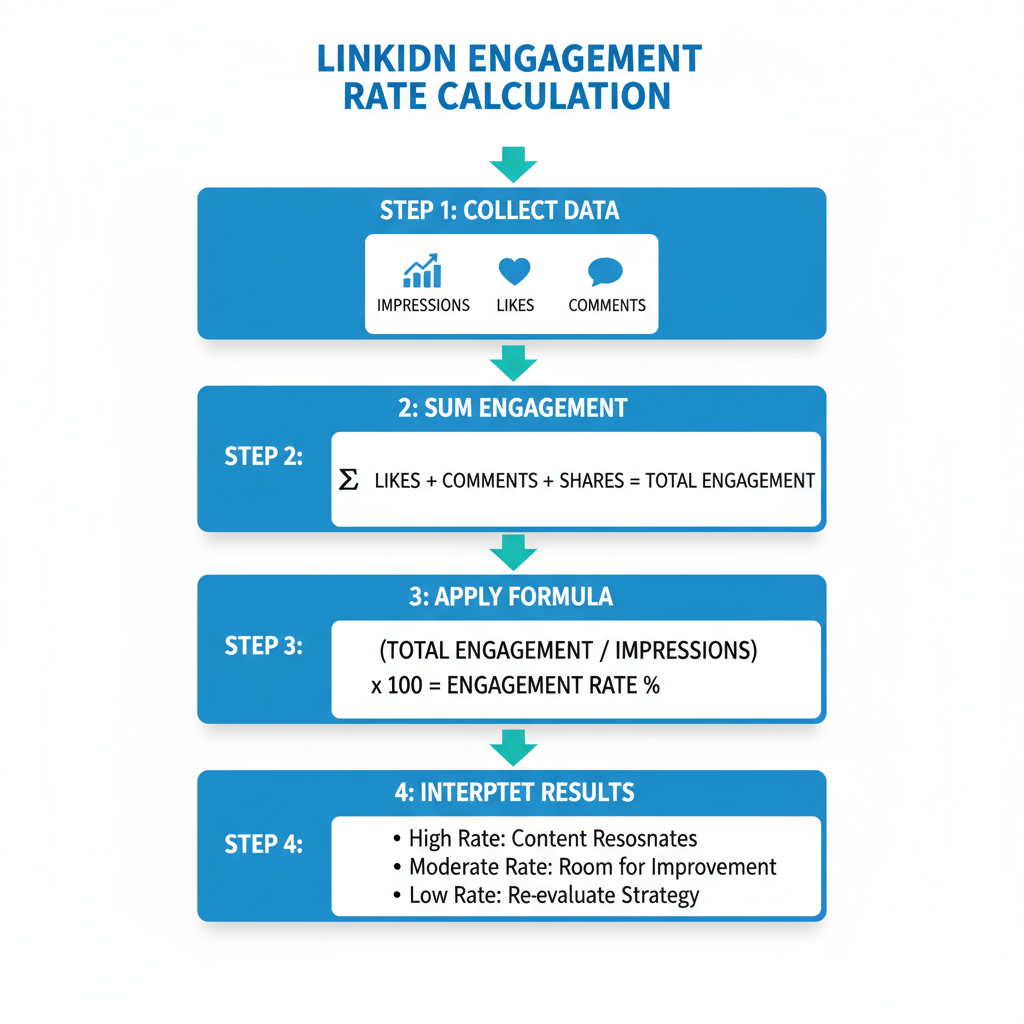
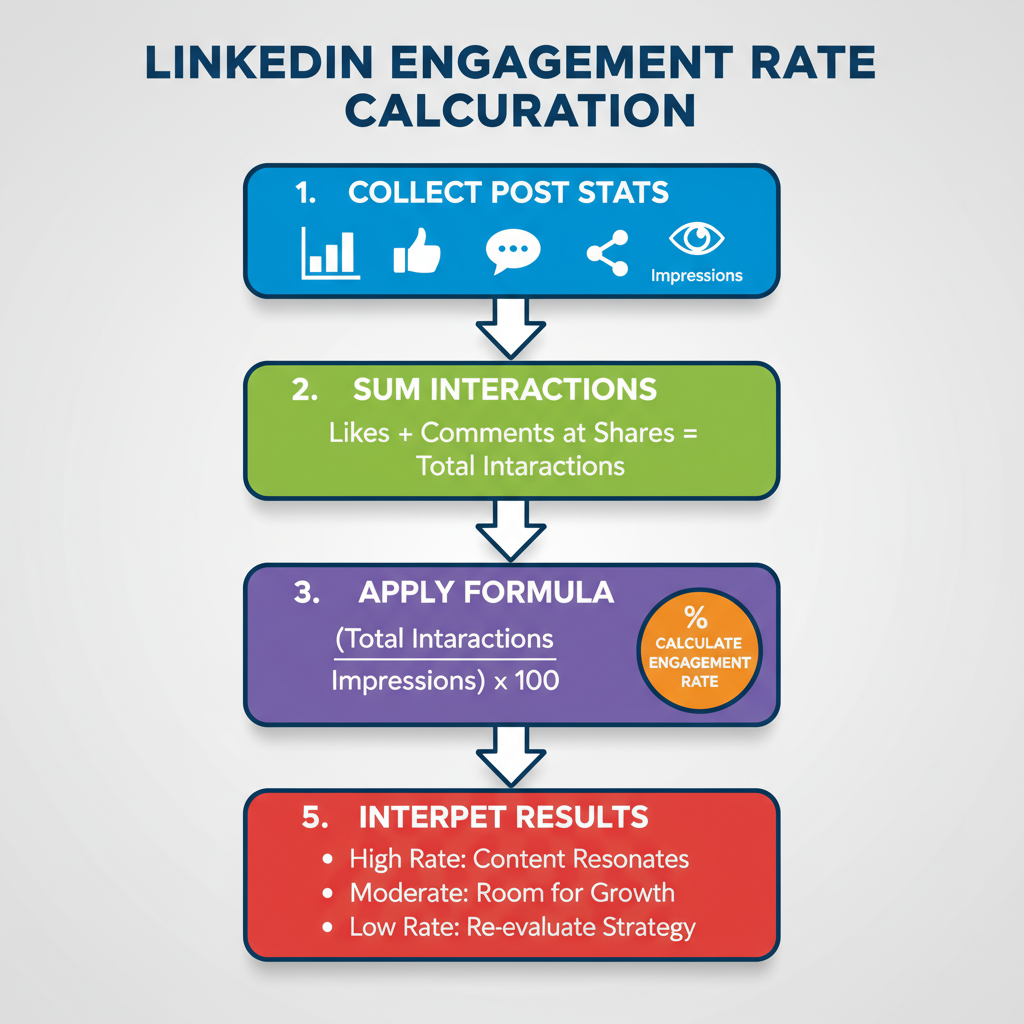
LinkedIn uses a straightforward formula:
Engagement Rate (%) = (Total Engagements / Total Impressions) × 100Total engagements can include:
- Reactions (like, celebrate, love, insightful, curious, etc.)
- Comments
- Shares
- Click-throughs (on links, media, or your profile)
- Follows resulting from content
Example: If your post earns 150 total engagements and 5,000 impressions:
(150 / 5000) × 100 = 3%---
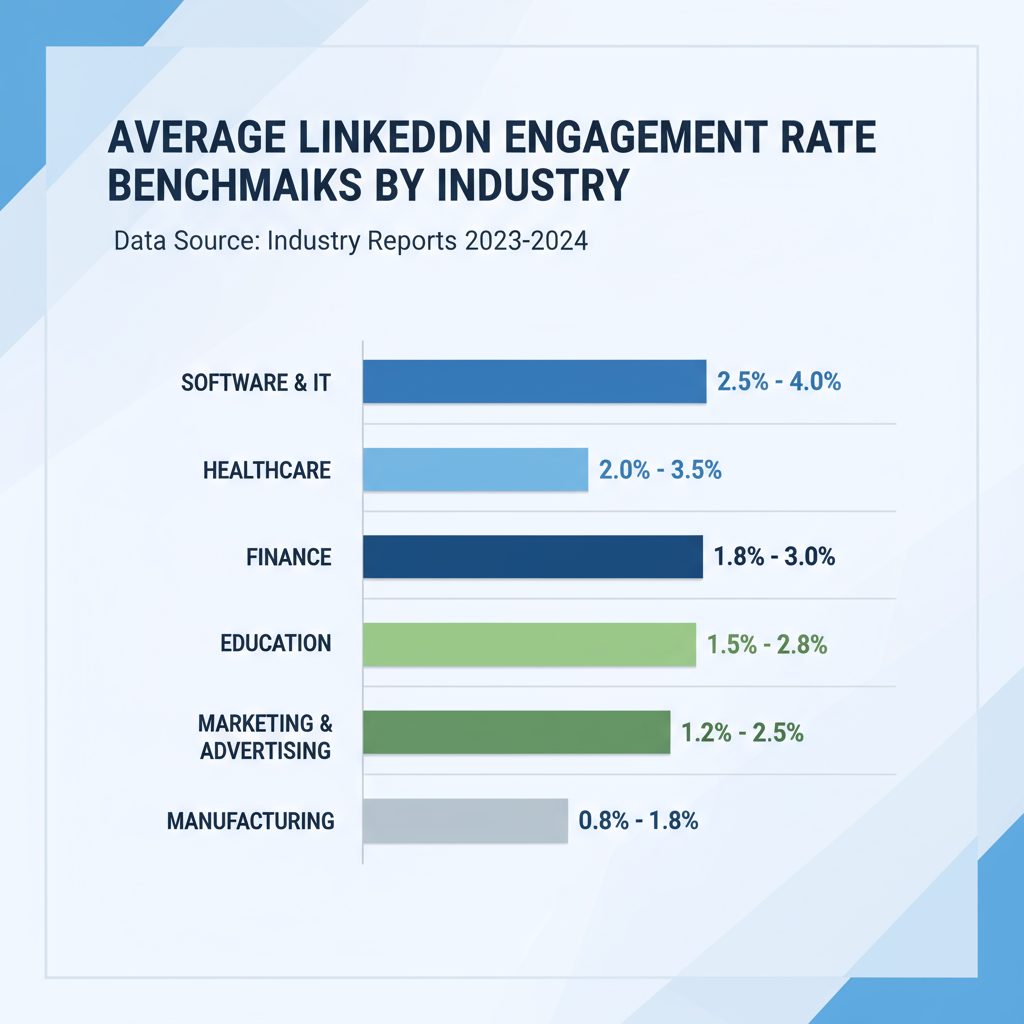
Average LinkedIn Engagement Rate Benchmarks by Industry
There’s no one-size-fits-all target, but industry-specific averages help measure your success against peers.
| Industry | Average Engagement Rate |
|---|---|
| Marketing & Advertising | 2.5% – 3.5% |
| Technology | 2% – 3% |
| Finance | 1.5% – 2.5% |
| Education | 3% – 4% |
| Healthcare | 1.5% – 2% |
Pro Tip: Anything above these ranges is generally considered strong for that industry.
---
Factors That Influence Engagement Rate
Your LinkedIn engagement rate is shaped by:
- Content Type – Visual and interactive posts often outperform plain text.
- Posting Time – Publishing when your audience is most active maximizes reach.
- Audience Size – Smaller, niche audiences often engage more proportionally than large, varied networks.
- Relevancy – Posts aligned with trending topics or audience challenges perform better.
- Consistency – Frequent, predictable posting builds trust and anticipation.

---
How to Measure Your Engagement Rate (Step-by-Step)
- Access LinkedIn Analytics
- Company Pages: Analytics > Updates
- Personal Profiles: Use View analytics on each post.
- Gather Your Data
- Record total impressions and total engagements for each post.
- Apply the Formula
- `(Total Engagements ÷ Total Impressions) × 100`
- Track Over Time
- Use a spreadsheet or analytics platform to monitor trends.
---
Tips to Improve LinkedIn Engagement Rate
Improving this metric is about strategy, not guesswork.
1. Diversify Content Formats
Experiment with:
- Native videos
- Carousels
- Infographics
- Document uploads
- Text posts with bold hooks
2. Maintain Posting Rhythm
Aim for 2–4 posts weekly to remain visible without oversaturating feeds.
3. Optimize Post Timing
Test days and times—engagement often peaks midweek for many industries.
4. Prompt Audience Interaction
Close posts with questions or requests for feedback.
5. Use LinkedIn’s Native Features
Polls, events, and other platform-native content often get priority placement.
---
Examples of High-Engagement Post Types
- Polls
- Interactive, quick, and algorithm-friendly.
- Carousels
- Multiple slides that encourage swiping for in-depth info.
- Native Videos
- Uploaded directly to LinkedIn, ideal for tutorials or insights.

---
Common Mistakes to Avoid
- Clickbait Headlines – They may attract clicks but lower long-term trust.
- Overposting – Can reduce per-post interaction rates.
- Ignoring Comments – Misses the chance for two-way engagement.
- Copy-Paste Crossposting – Format content to suit LinkedIn’s audience style.
---
Tracking Tools and Analytics to Monitor Progress
Tracking performance over time is critical.
Native LinkedIn Analytics – Free, accessible, and built-in.
Third-Party Tools – Offer deeper insights and scheduling:
| Tool | Key Features | Pricing |
|---|---|---|
| Shield Analytics | Personal profile metrics, compare posts | From $6/mo |
| Hootsuite | Scheduling, comprehensive analytics, monitoring | From $49/mo |
| Sprout Social | Advanced analytics, reporting, CRM integration | From $249/mo |
| SocialPilot | Team schedules, multi-platform posting | From $30/mo |
---
Key Takeaways for Sustaining a Strong Engagement Rate
- Measure regularly using analytics tools.
- Stay adaptive to content performance and audience trends.
- Balance quality over quantity to keep followers receptive.
- Engage actively by responding to comments and connecting with your network.
- Test new ideas to discover what drives the most interaction.
---
By understanding what is a good engagement rate on LinkedIn in your sector, tracking it consistently, and applying targeted strategies, you can build a community that interacts with your content—boosting visibility, credibility, and measurable business outcomes.
Start tracking your LinkedIn engagement rate today and experiment with fresh formats to see your numbers climb.


