Good Engagement Rate on Twitter: Benchmarks and Tips
Learn what a good Twitter engagement rate is, see industry benchmarks, calculate it step-by-step, and get tips to boost your social media results.

Understanding a Good Engagement Rate on Twitter
Twitter (now X) can be a powerful marketing and networking tool — but follower count alone doesn't tell the full story. What truly indicates your impact is engagement rate, a key metric for social media success.
In this guide, you'll learn what is a good engagement rate on Twitter, discover industry benchmarks, get step-by-step calculation instructions, and apply actionable tips to steadily improve your results.
---
What Is Twitter Engagement Rate?
On Twitter, the engagement rate measures the percentage of people who interact with your tweet compared to the total impressions it receives. These interactions can include:
- Likes (Favorites): Users express approval.
- Retweets: Your tweet is shared with other timelines.
- Replies: Direct responses or comments.
- Link Clicks: Traffic driven to external content.
- Profile Clicks: Visitors curious about you.
- Hashtag Clicks: Users exploring a conversation topic.
- Media Expansions: Clicks to view images or videos larger.
In short: Engagement rate reveals how compelling and relevant your content is to your followers and the broader audience.
---
How to Calculate Twitter Engagement Rate
Calculating engagement rate is simple but critical for monitoring social media performance.
Step-by-Step Calculation
- Log in to Twitter Analytics
- Visit analytics.twitter.com and select the tweet you want to analyze.
- Identify Total Engagements
- This count includes all interactions: likes, retweets, replies, clicks.
- Find Impressions
- Impressions are the number of times your tweet appeared in someone’s feed.
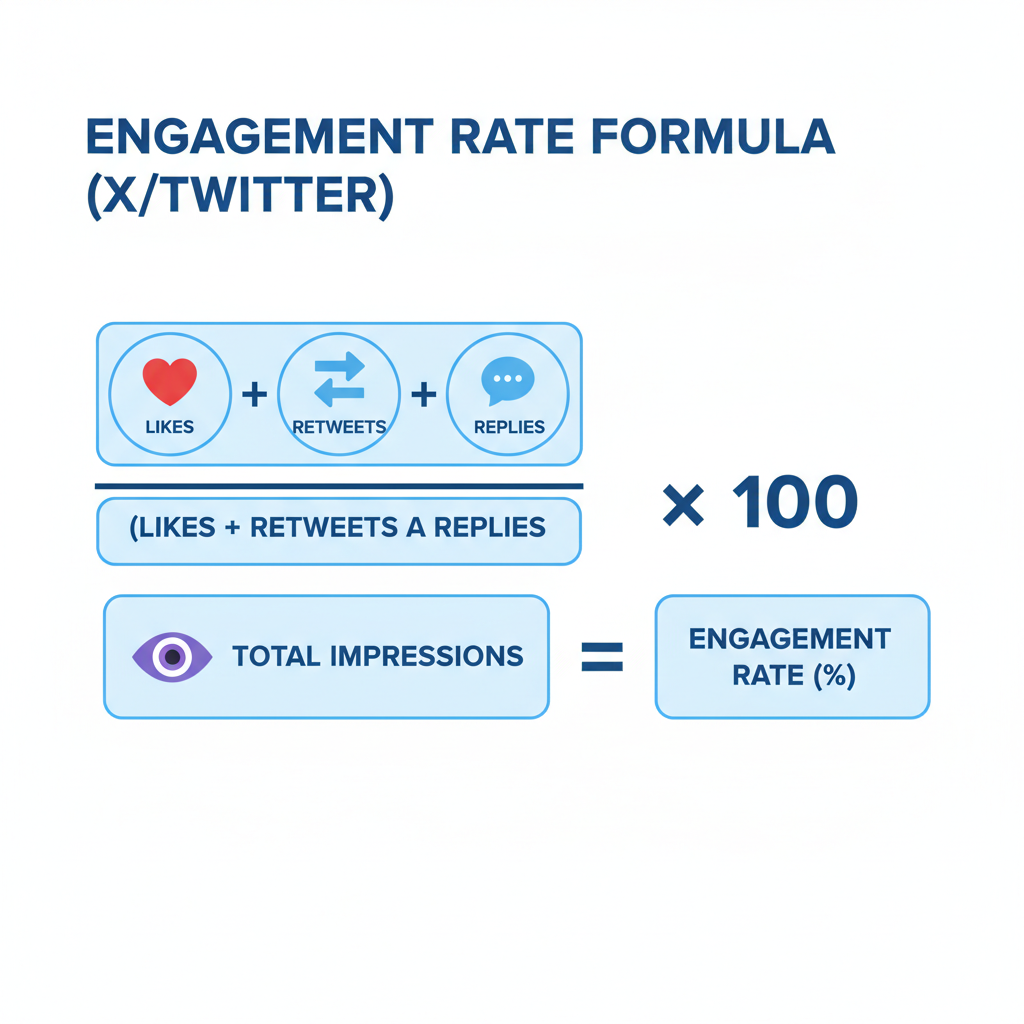
- Apply the Formula
Engagement Rate (%) = (Total Engagements ÷ Total Impressions) × 100Example:
If your tweet got 50 engagements and 2,000 impressions:
Engagement Rate = (50 ÷ 2000) × 100 = 2.5%---
Benchmarks for Twitter Engagement Rates
Engagement rates vary widely depending on audience size. Smaller accounts often enjoy higher rates because of closer community connections.
| Follower Range | Average Engagement Rate |
|---|---|
| <1,000 followers | 2% - 5% |
| 1,000 - 10,000 | 1% - 3% |
| 10,000 - 100,000 | 0.5% - 1.5% |
| >100,000 | 0.1% - 0.5% |
Note: These are general benchmarks; niche accounts or highly viral posts can exceed these averages.
---
Key Factors Affecting Engagement Rate
Several factors influence your Twitter engagement rate:
1. Audience Size
Large accounts often have lower rates due to broader, less-targeted audiences.
2. Niche Relevance
Specialized niches (e.g., data science, indie gaming) may enjoy high engagement thanks to concentrated interest.
3. Posting Frequency
Too few posts can lead to irrelevance, while too many can overwhelm followers.
4. Content Type
Tweets with media (images, videos, GIFs) typically outperform text-only posts.
5. Timing
Posting when your audience is active can dramatically boost interaction rates.
---
Best Practices to Improve Engagement
Understanding what is a good engagement rate on Twitter is only half the battle — the key is applying proven tactics to raise it.
1. Optimize Your Posting Time
Analyze when your followers are most active and schedule tweets during those windows.
2. Use Visual Media
Images, videos, and GIFs increase clicks and shares dramatically.
3. Craft Clear Calls to Action
Ask questions, run polls, or invite retweets to encourage specific actions.
4. Leverage Relevant Hashtags
Targeted hashtags improve discoverability without appearing spammy.
5. Engage With Your Audience
Respond to comments, retweet followers, and take part in popular discussions.
---
Case Studies: High Engagement Accounts
Example 1: Indie Author with 5,000 Followers
Consistently posts behind-the-scenes writing updates and uses niche hashtags. Average ER: ~4%.
Example 2: Tech Educator with 800 Followers
Shares Twitter threads with coding tips, prompting replies and shares. Average ER: 5%+.
Why They Perform Well
- Strong audience-content alignment
- Frequent two-way engagement
- Use of rich media (images, mini-videos)
- Optimized posting schedules
---
Common Engagement Rate Mistakes to Avoid
Avoid these mistakes if you want to maintain or boost your ER:
- Overposting without substance: Can cause unfollows.
- Ignoring feedback: Weakens trust.
- Poor formatting: Big blocks of text reduce readability.
- Generic content: Unoriginal posts disappear in busy feeds.
- Clickbait tactics: Temporary engagement gains can damage credibility.
---
Tracking Engagement Effectively
Twitter Analytics offers tweet-level and overall account data:
Key Data Points
- Tweets Tab: Shows ER for each tweet
- Audience Insights: Reveals demographics, interests
- Top Tweets: Highlights content worth replicating
Pro Tip: Export data monthly and log ER changes in a spreadsheet to identify performance trends.
---
Setting Realistic, Data-Driven Goals
If your account has 2,000 followers and a 2% ER, aim for 2.5% over three months. Use incremental improvements rather than pursuing unsustainable spikes.
Apply SMART goals:
- Specific: Increase ER by 0.5%
- Measurable: Track improvement via Twitter Analytics
- Achievable: Experiment with hashtags and visuals
- Relevant: Match brand objectives
- Time-bound: Achieve within 90 days
---
Why Engagement Rate Outshines Follower Count
Follower numbers reflect reach; engagement rate reflects impact. A small account with 5% ER may drive more conversions and loyalty than a large account with a 0.1% ER.
High engagement results in:
- Better visibility via platform algorithms
- Stronger community relationships
- Higher conversion and retention
---
Conclusion
Mastering what is a good engagement rate on Twitter means focusing on delivering value in every post. By measuring ER, benchmarking realistically, and implementing targeted tactics — from timing optimization to audience interaction — you can shift from vanity metrics to meaningful impact.
High engagement signifies genuine resonance with your audience. Keep testing formats, tracking data, and engaging authentically. Start analyzing your metrics today and commit to continuous improvement to build a thriving Twitter presence.