LinkedIn Impressions Benchmark and Engagement Guide
Learn how LinkedIn impressions are calculated, see industry benchmarks, and discover strategies to boost reach and engagement organically.
Understanding LinkedIn Impressions
If you are asking what is a good number of impressions on LinkedIn, the answer starts with understanding the metric itself. LinkedIn impressions measure how many times your post, article, or update is displayed on a user's screen—whether or not they click or engage. This can occur in feeds, search results, notifications, or through direct page visits.
An "impression" is counted each time content is loaded. For example, if your post is shown to 500 people, that's 500 impressions; if one user sees it twice, both views count. Impressions are a useful starting point for gauging reach, even though they do not reflect quality or engagement.

---
How Impressions Are Calculated
LinkedIn uses several delivery points to count impressions:
- Feed view: Post is rendered as a user scrolls through their feed.
- Direct visit: Content appears when a user visits your personal or company profile.
- Search visibility: Post shows up in search based on keyword relevance.
Repeated views by the same user can inflate totals, but this isn’t the same as unique reach.
---
Factors Influencing Impression Counts
Several key variables shape your LinkedIn impression numbers:
1. Network Size
A larger first-level network increases potential initial distribution before engagement metrics influence further reach.
2. Posting Frequency
Regular posting keeps you visible. Long gaps can cause impressions to stagnate.
3. Content Type
- Text updates can appeal to information-focused audiences.
- Thought leadership articles often resonate with niche professionals.
- Native videos tend to perform well due to LinkedIn's algorithm preferences.
---
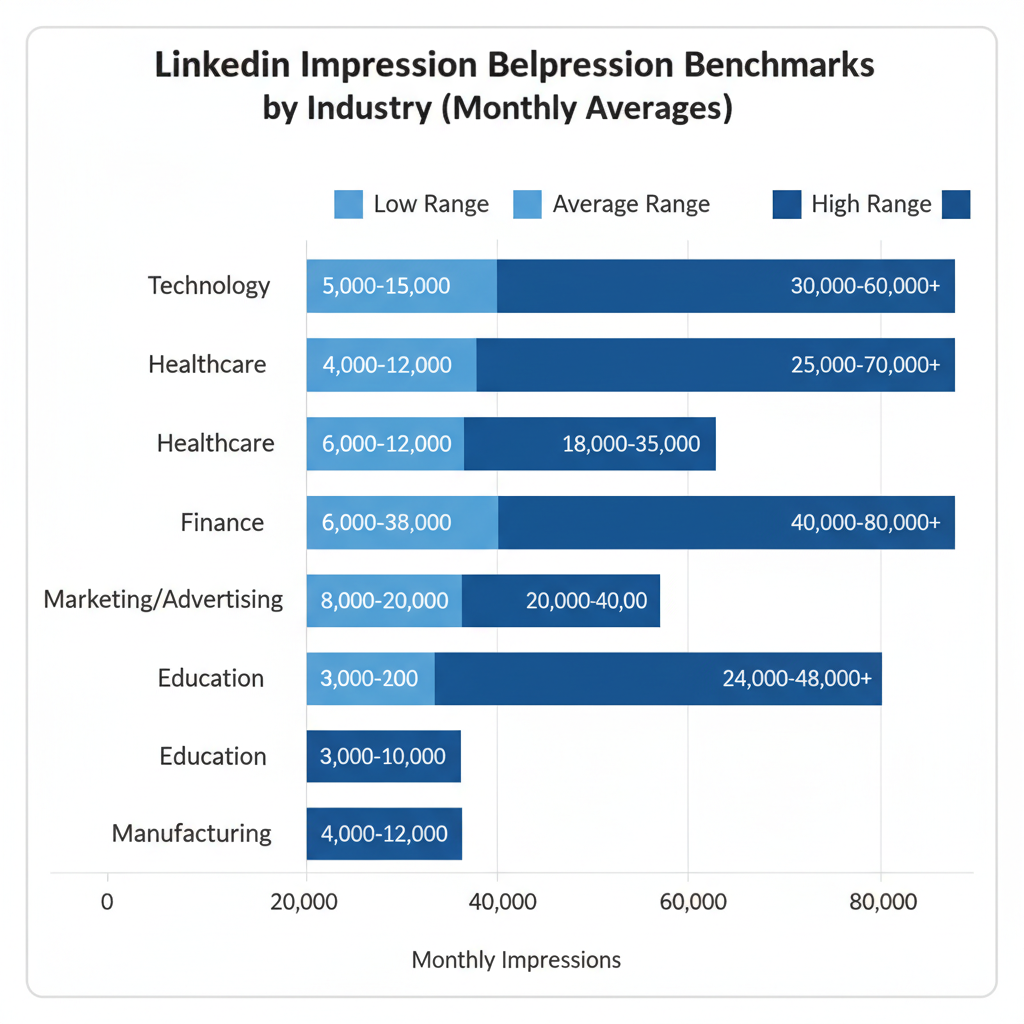
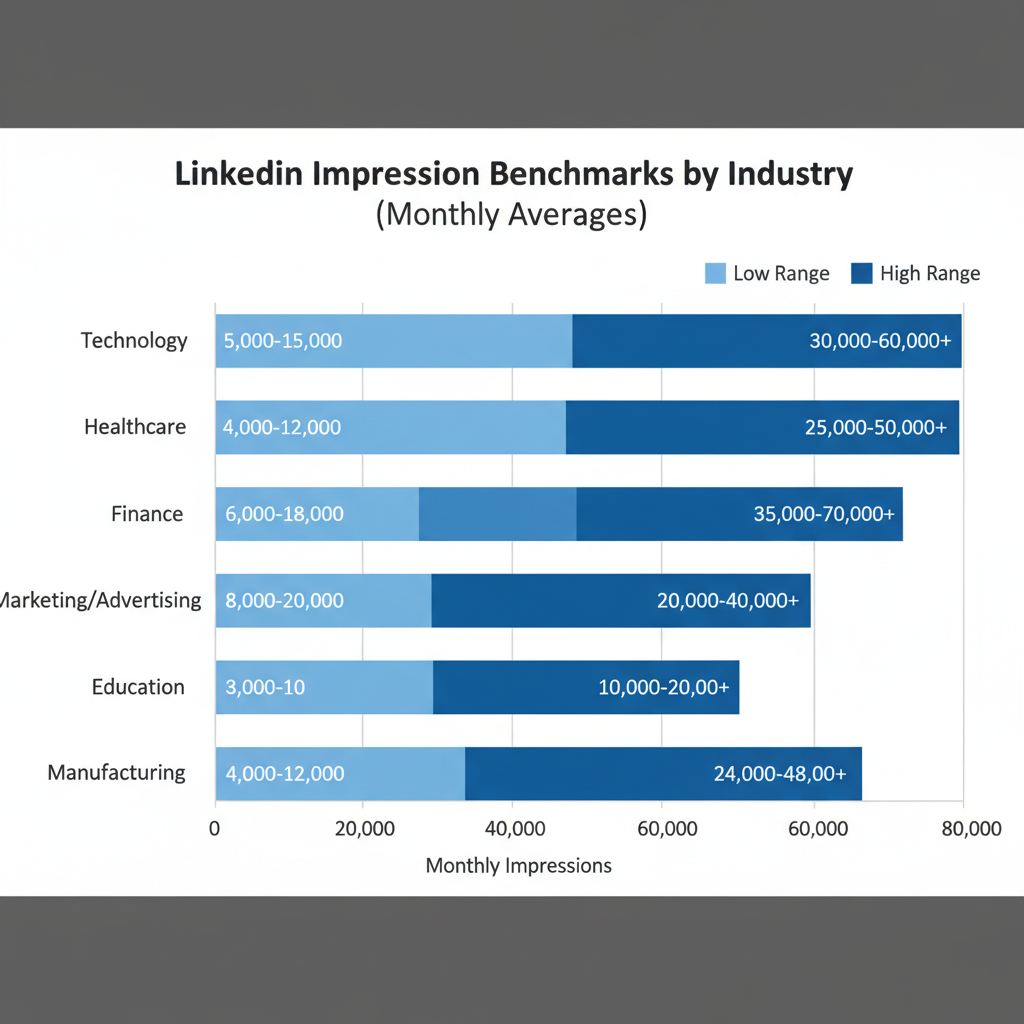
Industry Benchmarks for LinkedIn Impressions
So, what is a good number of impressions on LinkedIn? While results vary, here are general benchmarks:
| Network Size | Average Impressions per Post | Notes |
|---|---|---|
| < 500 connections | 100 – 500 | Varies by niche and post quality |
| 500 – 2,000 connections | 500 – 2,000 | Strong range for niche engagement |
| 2,000+ connections | 2,000 – 10,000+ | Potential for semi-viral reach |
These figures reflect consistent, high-quality posting in active networks.
---
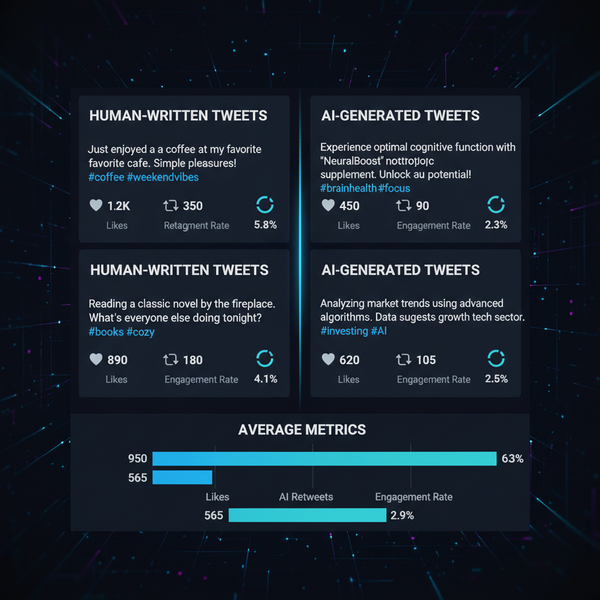
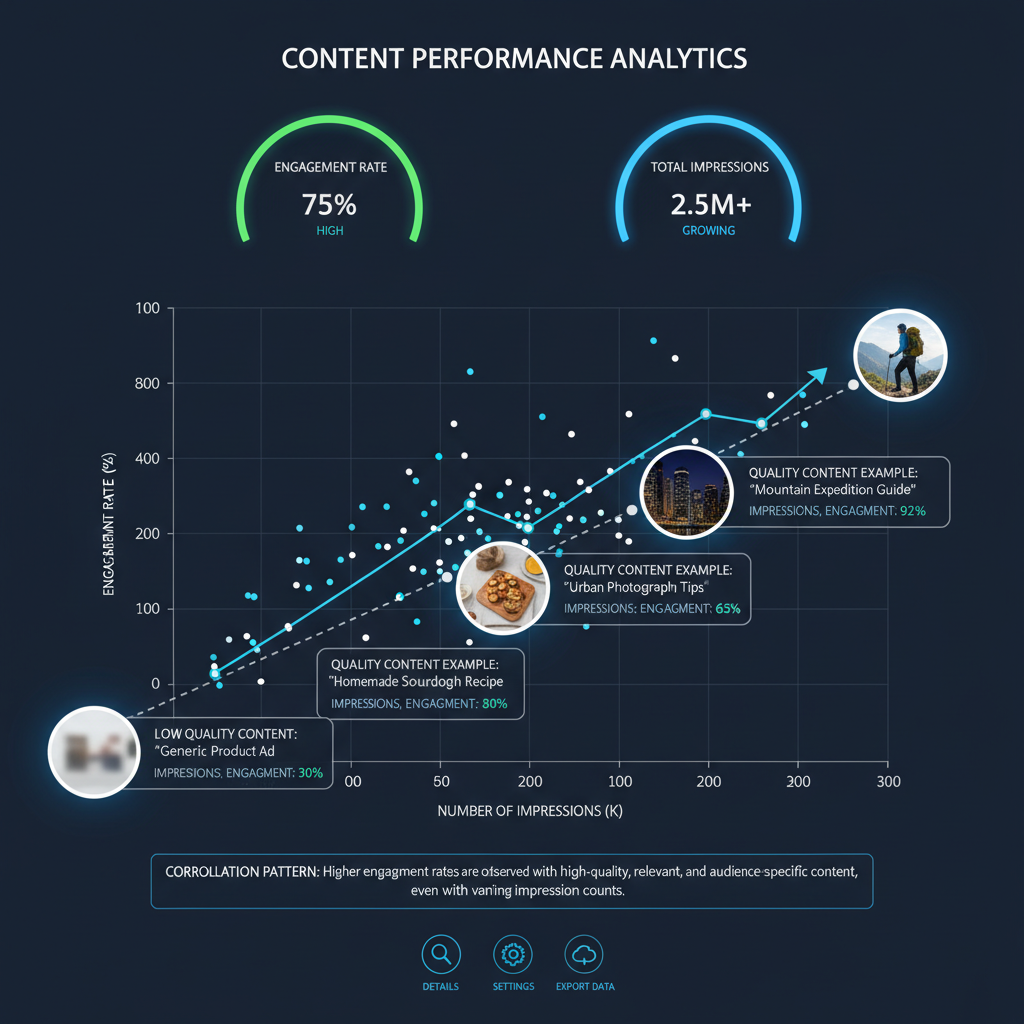
Engagement Rate vs. Impression Quality
Impressions measure visibility, but not success. Low engagement despite high impressions may signal weak content resonance. Engagement rate is calculated as:
Engagement Rate (%) = (Likes + Comments + Shares) / Impressions × 100A typical healthy organic LinkedIn rate ranges 2–5%, with niche or highly relevant posts sometimes exceeding 10%.
---
Personal Profile vs. Company Page Impressions
Individual accounts often get more organic reach than company pages, as LinkedIn ranks person-to-person interaction higher.
| Type | Reach Characteristic | Typical Use Case |
|---|---|---|
| Personal Profile | Boosted to connections by default | Thought leadership, personal brand updates |
| Company Page | Dependent on followers and paid promotion | Corporate marketing, product launches |
---
Seasonal and Algorithm Changes
Impression counts can fluctuate due to:
- Seasonal cycles: Lower activity during holidays.
- Algorithm updates: Changes in prioritizing native vs. external content.
- Trending topics: Timely posts tied to industry news often spike temporarily.
---
Tips to Increase LinkedIn Impressions Organically
Boost impressions naturally by:
- Posting at optimal times: Weekday mornings or lunch hours.
- Engaging actively: Reply to comments to resurface content.
- Leveraging rich media: Quality images or short native videos.
- Using targeted hashtags: 3–5 relevant tags increase discoverability.
- Collaborating and tagging peers: Expand reach with shared audiences.
- Publishing long-form articles: Gain impressions via search visibility.
---
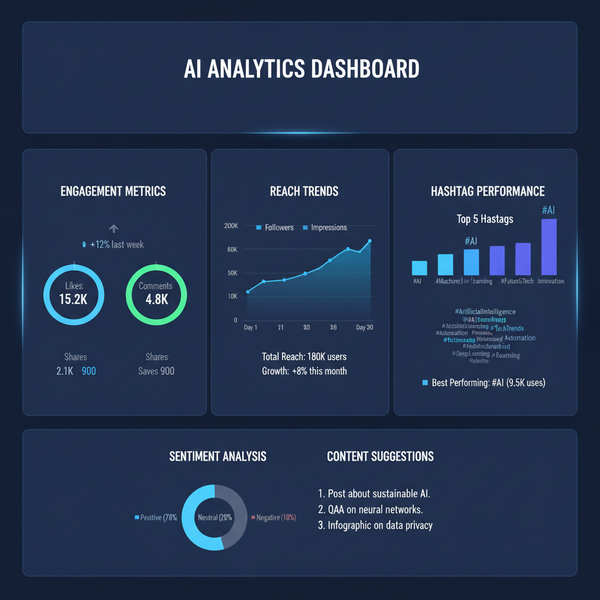
Tracking and Analyzing Impressions in LinkedIn Analytics
Analytics are accessible on:
- Personal profiles: Post-specific metrics such as impressions, clicks, engagement types.
- Company pages: Dashboard with aggregated trends and audience insights.
Monitor metrics like:
- CTR (Click-Through Rate)
- Interaction breakdown (comments, shares, reactions)
- Follower growth patterns
---
Interpreting Impression Trends Relative to Your Goals
Aim to pair impression growth with your goals:
- Lead generation: Correlate spikes with lead capture data.
- Brand awareness: Look for steady month-over-month increases.
- Community building: Focus on engagement ratio rather than sheer reach.
Gradual growth often signals steady posting and network expansion, while sudden drops may reflect algorithm shifts or inactivity.
---
When Impressions Should Not Be the Main KPI
Treat impressions as an indicator, not a final metric:
- Conversion-centric strategies: Focus more on clicks and sign-ups.
- Engagement-heavy plans: Deep interactions matter more than eyeballs.
- Niche marketing: Smaller, highly engaged audiences outperform broad passive ones.
---
Conclusion
Ultimately, deciding what is a good number of impressions on LinkedIn depends on your network size, objectives, and content type. Use impressions to monitor reach, but pair them with engagement and conversion data for a fuller success picture.
By aligning your posting habits with algorithm tendencies, aiming for optimal timing, and leveraging analytics insights, you can steadily increase both impressions and their impact. Invest in value-driven content—because sustainable LinkedIn success turns visibility into measurable action.
Start refining your LinkedIn strategy today to grow impressions, engagement, and meaningful outcomes.