What Is a Twitter Impression and How to Measure Engagement
Learn what Twitter impressions are, how they differ from reach and engagement, and practical strategies to track and grow your tweet visibility.
What Is a Twitter Impression and How to Measure Engagement
Understanding Twitter impressions (on X) is essential for anyone aiming to grow their audience and optimize content performance. Impressions tell you how often your tweets are shown to users — a key visibility metric that, when paired with engagement data, can help you refine strategy and boost impact. In this guide, we break down what impressions mean, how they work, how they differ from reach and engagement, and actionable steps to increase them.

---
Defining Twitter Impressions
A Twitter impression is recorded every time a tweet appears on someone’s screen. This includes:
- Appearing in followers’ timelines
- Displayed in search results
- Shown as part of a list, trending topic, or embedded tweet
- Appearing via retweets or quote tweets in someone else’s feed
It’s important to note that impressions do not require interaction. A user simply has to have the tweet visible in their feed for it to count.
How Impressions Are Counted
- Multiple views by the same user are counted separately — if one person sees the same tweet twice, that’s two impressions.
- Impressions are tracked in real time by Twitter Analytics and are cumulative over the tweet’s lifespan.
---
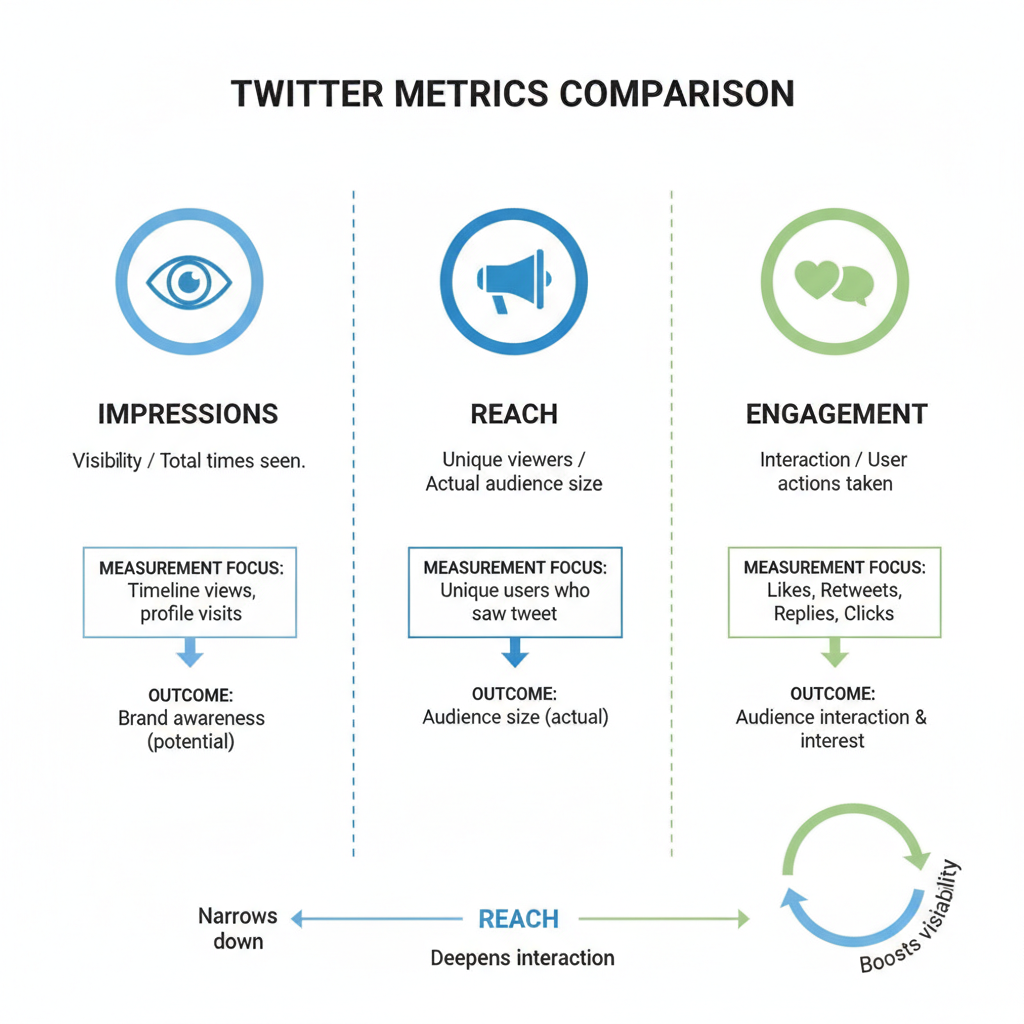
Impressions vs. Reach vs. Engagement
Many people confuse impressions with reach or engagement. Here’s a quick breakdown:
| Metric | Definition | What It Measures |
|---|---|---|
| Impressions | Number of times a tweet is displayed on screens | Potential exposure |
| Reach | Number of unique users who saw your tweet | Audience size |
| Engagement | Number of interactions (likes, retweets, clicks, replies) | User actions |
Key takeaway: Impressions indicate visibility, reach reflects unique viewers, and engagement shows user actions taken.
---
Finding Impression Metrics in Twitter Analytics
Twitter Analytics is your go-to tool for understanding performance.
- Access analytics: Click on “More” in your Twitter sidebar, then select Analytics.
- Switch to Tweets tab: This shows metrics for each tweet.
- Check the “Impressions” column: Every tweet will display its impression count.
- Review trends: Look at your monthly summary for total impressions.
Pro tip: Export your analytics data to a spreadsheet for deeper, long-term analysis.
---
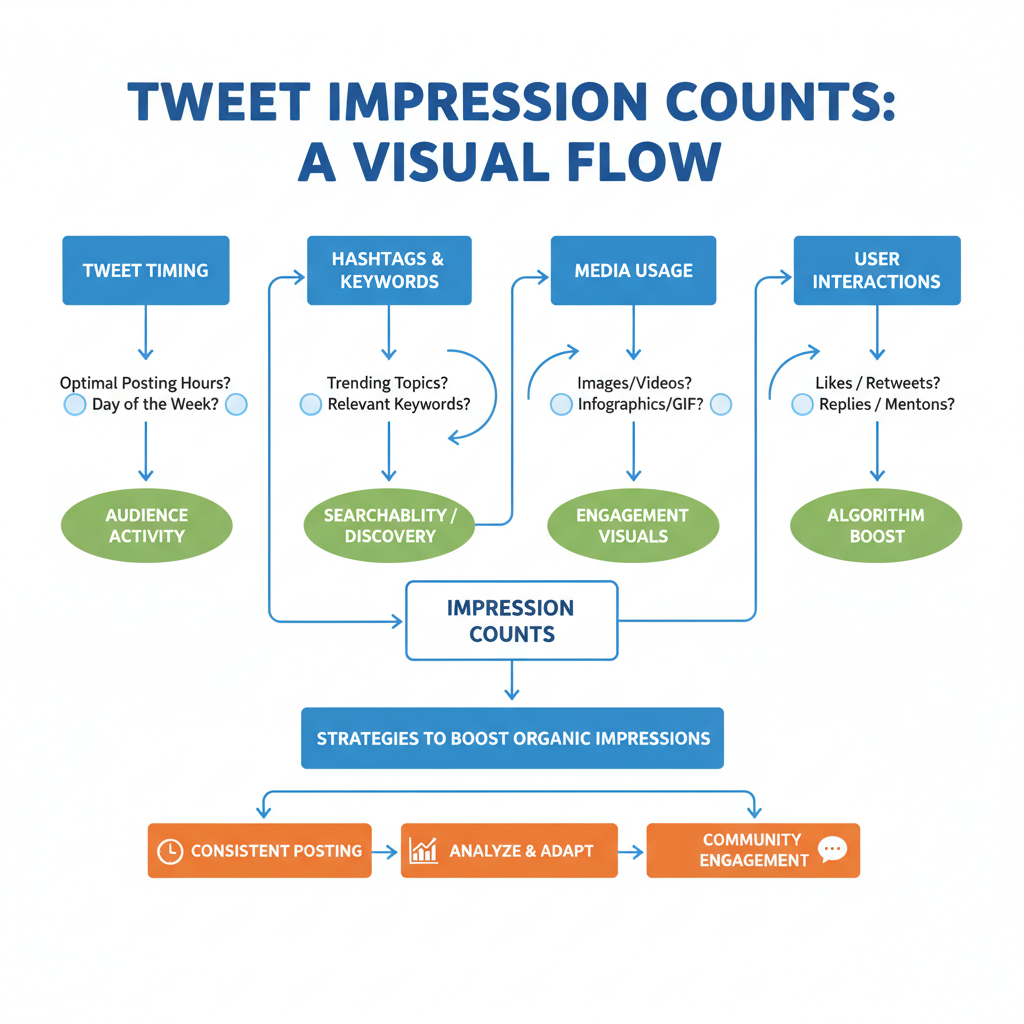
Factors That Influence Impression Counts
Impressions fluctuate based on several variables:
- Posting Time: Tweets sent during peak activity hours (e.g., early morning for business audiences) garner more views.
- Hashtags: Relevant, trending hashtags increase discoverability.
- Your Follower Count: More followers mean more potential appearances in feeds.
- Retweets and Mentions: Amplification through other accounts boosts impressions.
- Tweet Format: Visuals and multimedia often improve visibility in crowded feeds.
---
Why Impressions Reflect Visibility, Not Success
While a high impression count might look impressive, it doesn’t always equate to success.
For example:
- A tweet with 20,000 impressions but minimal engagement may have been seen but lacked impact.
- A tweet with 2,000 impressions and high engagement could be more valuable for relationship building and driving conversions.
---
Proven Strategies to Increase Organic Impressions
To grow your impressions without paid promotion, focus on organic reach tactics:
- Post Consistently: Maintain regular posting to keep content present in feeds.
- Engage With Others: Reply, like, and retweet within your niche to boost visibility.
- Use Hashtags Wisely: Stick to 1–3 relevant hashtags per tweet.
- Leverage Media: Include images, GIFs, and videos to stand out in timelines.
- Craft Strong Hooks: Make the first few words compelling to stop scrolls.
- Join Trending Conversations: Timely posts can benefit from algorithm boosts.
---
Examples: High vs. Low Impression Tweets
Here’s a quick comparison:
| Tweet | Impressions | Engagement Rate | Reason for Performance |
|---|---|---|---|
| “Big news today 🚀 We just launched our new product #TechLaunch” (with image) | 15,000 | 5% | Timely news, hashtags, and visual appeal |
| “It’s Monday.” (no image) | 500 | 0.5% | No context or value; low engagement led to reduced visibility |
In the first case, timing, hashtag relevance, and visuals generated significant visibility.
---
How to Use Impression Data to Improve Strategy
When you review impression trends:
- Identify top performers — Look for content similarities in topic, timing, or format.
- Spot underperformers — Adjust posting strategies to fix downward trends.
- Experiment with formats — Compare impressions from text-only vs. media-rich tweets.
This allows you to fine-tune content that not only gets seen but also drives results.
---
Limitations of Impressions as a Metric
Remember that impressions are:
- Surface-level: They show only how often a tweet appeared, not user sentiment or dwell time.
- Not tied to conversions: High visibility does not necessarily mean high ROI.
- Affected by algorithms: Changes to how Twitter displays content can impact impression counts overnight.
---
Summary and Next Steps
In short, impressions answer the question “How often is my content seen?”, but not “How effective is my content?” For a complete view:
- Track impressions alongside engagement rates, click-throughs, and conversion metrics.
- Use them to refine timing, content type, and topic focus.
- Remember: visibility is just the first step toward marketing success.
By understanding what is a Twitter impression and applying these insights, you can create a data-informed Twitter strategy that builds reach, engages your audience, and enhances your brand presence. Start reviewing your analytics today and experiment with content approaches that maximize both visibility and impact.