What Is an Impression on Twitter (X)? How It’s Counted and Why It Matters
Learn what impressions on X (Twitter) are, how they're counted, where to find them, how they differ from reach and views, and practical ways to boost exposure.

Understanding how X (formerly Twitter) counts impressions is essential for interpreting exposure versus engagement and making smarter content decisions. This guide clarifies the definition, how impressions differ from reach and public views, where to locate your data, and how to use it to improve performance. You’ll also get practical tactics to increase impressions without chasing vanity metrics.
What Is an Impression on Twitter (X)? How It’s Counted and Why It Matters


If you’ve ever asked “what is an impression on Twitter,” you’re not alone. X (formerly Twitter) surfaces several exposure and engagement numbers, and it can be confusing to know which one to watch. This guide clarifies what an impression actually is, how it’s counted, where to find your data, and how to use it to improve results.
---
Plain-English Definition: Impression vs Unique View
- An impression on X is one counted exposure of a post (Tweet) to a user. If your post is rendered on someone’s screen in Home, Search/Explore, a profile, a thread, or via a repost, that’s typically one impression.
- Impressions are not unique. The same person can contribute multiple impressions if they see your post more than once (e.g., in Home and later in a profile view).
- A unique view (often called “reach” elsewhere) attempts to count distinct people. X focuses primarily on impressions in its analytics, not unique reach for organic posts.
Key takeaway: Impressions tell you “how many times it was shown,” not “how many people saw it.”
---
How Impressions Are Counted
Impressions are recorded when a post is rendered on X’s surfaces, including:
- Home timeline and Following/For You feeds
- Search/Explore results and topic feeds
- Profile timelines (yours or others’)
- Replies/threads when your post appears in the conversation
- Reposts/Quote posts where your original is shown
What typically does not count:
- Screenshots or copy-pasted content off-platform
- Most off-platform views (e.g., third-party sites) unless the official embed is used and X can track it
- Email previews, messaging app previews, or scraped copies of your content
Notes and edge cases:
- Quick scrolls can still count if the post loaded on-screen long enough to register; there is no guaranteed “dwell time” threshold publicly documented.
- Anti-spam and quality systems may discard certain exposures (e.g., from obvious bot activity).

---
Impressions vs Other Metrics (and “Views”)
Below is a side-by-side to reduce confusion.
| Metric | What it means | Where you see it | Nuances |
|---|---|---|---|
| Impressions | Total times a post was shown on X surfaces (not unique) | Post analytics, Analytics dashboard, Ads | Primary exposure metric; used heavily in reporting |
| Views (public counter) | Publicly visible exposure count on the post | On the post itself | Intended to reflect exposures; may update on a different cadence and not always match analytics exactly |
| Reach (unique exposure) | Estimated distinct people who saw it | Limited availability organically; more common in ads | Not the same as impressions; 1 person can drive multiple impressions |
| Engagements | Clicks, likes, replies, reposts, quotes, profile clicks, etc. | Post analytics, Analytics dashboard | Sum of interactions; can drill into types |
| Engagement rate | Engagements ÷ Impressions | Post analytics, Ads | Helps compare performance across posts of different reach |
| Profile visits | Clicks to your profile from posts or elsewhere | Account analytics | Good proxy for interest in you/brand |
| Link clicks | Clicks to external URLs in your post | Post analytics, Ads | Pair with UTM tags for off-platform tracking |
| Video views | Plays beyond an internal threshold (e.g., seconds viewed) | Post analytics, Ads | Counts differ by video objective; watch the definition used |
Public “Views” vs analytics “Impressions” explained
- Both are intended to reflect exposures on X, but they may not line up in real time.
- Differences can stem from timing, deduplication, anti-spam filtering, or product experiments.
- For analysis and ads billing, rely on analytics impressions.
---
Organic vs Paid: Why Numbers May Not Match
- Organic impressions: Generated by algorithmic distribution, follower timelines, search, profiles, reposts, and conversations. Factors include your followers’ activity, content relevance, and recency.
- Ad impressions (X Ads): Counted when the ad creative is rendered in a user’s experience within your targeting. Billing and reporting depend on ad objective.
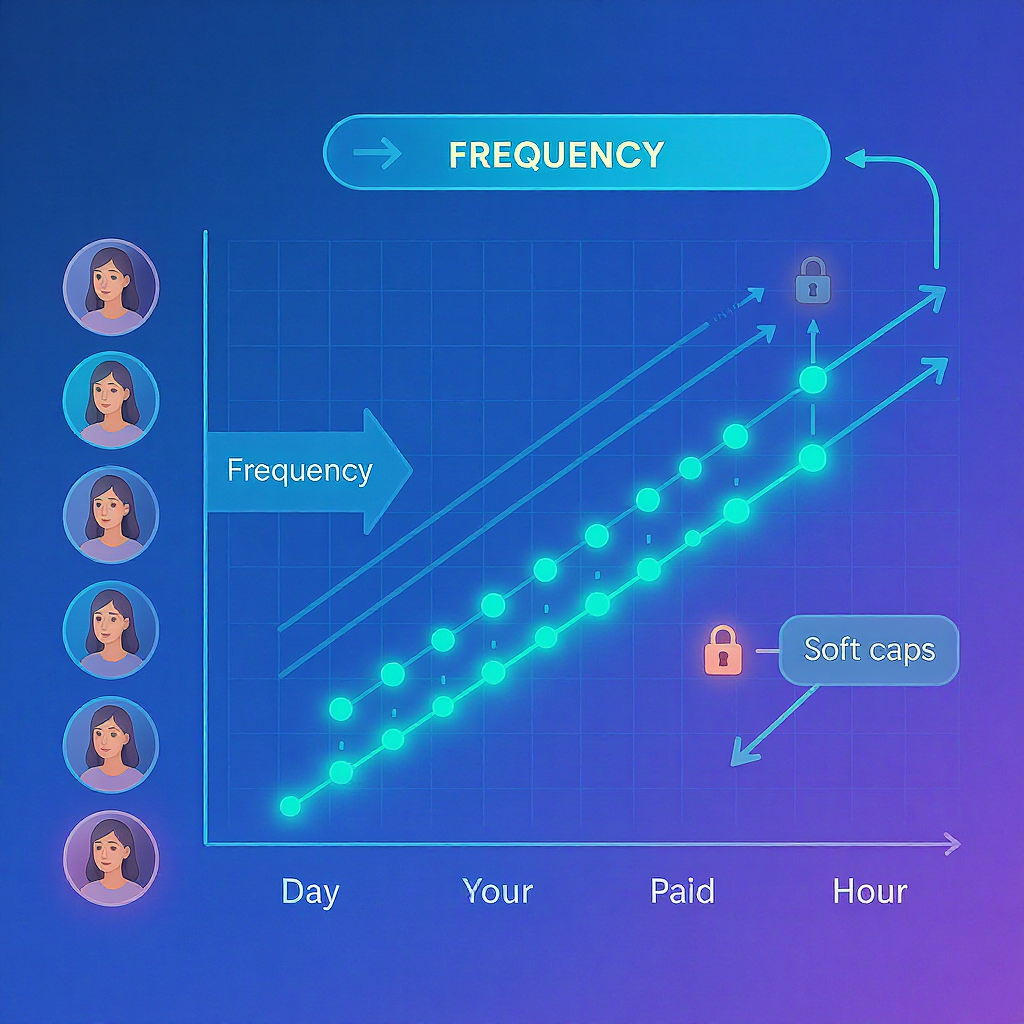
Frequency and pacing
- Frequency: Ads can be controlled to limit exposures per user (varies by objective and campaign settings). Reach-focused objectives often expose frequency controls.
- Pacing: Budgets are delivered over time; auctions and demand fluctuate, so impressions may be uneven across hours or days.
Why paid vs organic impression counts differ
- Targeting scope and auction dynamics
- Creative placement and eligibility
- Frequency caps, budget limits, and pacing logic
- Quality and relevance scores
---
Where to Find Your Data
Per-post analytics
- On each post, click “View post analytics” to see impressions, engagements, engagement rate, link clicks, and more.
Account-level analytics
- Access your Analytics dashboard to view Tweet Activity over date ranges (e.g., last 28 days and custom ranges), top posts, and totals.
- Export CSVs for deeper analysis and backups.
Filtering and date ranges
- Use date selectors to isolate campaigns, launches, or events.
- Filter by media type (text vs. image/video), if available, to compare performance patterns.
Exporting and basic analysis
- Exports include columns like time, impressions, engagements, detail expands, link clicks, profile clicks, and more.
- Compute engagement rate, CTR, or create pivot tables by topic or format.
Example CSV header snippet
time,permalink,impressions,engagements,likes,replies,retweets,quotes,profile_clicks,link_clicks,detail_expands
2025-09-01 12:34:56,https://x.com/you/status/123,7850,412,120,17,43,9,83,61,79
Quick engagement-rate calculation in Python
import csv

with open("tweet_activity.csv", newline="") as f:
    reader = csv.DictReader(f)
    for row in reader:
        impressions = int(row["impressions"]) or 0
        engagements = int(row["engagements"]) or 0
        er = (engagements / impressions) * 100 if impressions else 0
        print(row["permalink"], f"{er:.2f}%")
Tip: Add UTM parameters to your links (e.g., ?utm_source=x&utm_medium=social&utm_campaign=launch) to connect impressions and clicks with website analytics.
---
Why Impressions Matter (And When They Don’t)
- Awareness and top-of-funnel: Impressions reveal how often your message was shown, a leading indicator of potential impact.
- CPM context: In ads, you’ll often evaluate cost per thousand impressions (CPM) to benchmark efficiency.
- Diagnosing distribution: Low impressions can signal limited relevance, poor timing, or a stale network.
- When impressions don’t matter as much: If your goal is signups or sales, prioritize downstream actions (link clicks, conversions). High impressions with low engagement may indicate weak hooks, irrelevant audiences, or creative fatigue.
Interpretation tips
- High impressions + low engagement rate: The content reached people but didn’t compel action; refine the opening hook, visual, or call to action.
- Low impressions + solid engagement rate: Strong content among a small audience; scale with reposts, collaborators, or paid promotion.
---
Benchmarks and Context
Many factors drive impression volume:
- Audience size and freshness (active, engaged followers)
- Recency and posting cadence
- Topic relevance and timeliness (news/trends)
- Media type (video and image often earn more initial distribution than plain text)
- Conversation dynamics (replies and quote posts)
Typical engagement-rate ranges (organic)
| Account size | Typical engagement rate | Notes |
|---|---|---|
| < 10K followers | 1.0% – 3.0%+ | Smaller audiences can show higher % with tighter communities |
| 10K – 100K | 0.8% – 2.0% | More variability by topic and media type |
| 100K+ | 0.3% – 1.0% | Larger reach often lowers percentage rates |
Baseline reality: Benchmarks vary by niche. Track your own rolling averages and aim to beat yourself.
---
How to Increase Impressions
Content signals
- Lead with a clear hook in the first line.
- Use native media (images, short video, GIFs). Add alt text for accessibility.
- Threads: Break complex ideas into scannable parts; use a strong opener.
- Vary formats (polls, questions, charts) to trigger different engagement modes.
Timing and cadence
- Post when your audience is active; test weekday mornings vs. afternoons.
- Maintain a consistent schedule to build habit and recency signals.
Search and discovery
- Use 1–2 strategic hashtags or keywords relevant to your topic (avoid spammy stuffing).
- Name-drop clear entities (products, technologies) people search for.
Tapping into conversations
- Reply early to trending discussions with substance, not spam.
- Quote-post with a unique angle; add data or a contrarian take.
Collaborations and mentions
- Tag collaborators, co-authors, brands, or events.
- Cross-promote with partners to reach non-overlapping audiences.
When to use paid promotion
- Boost high-signal posts (early engagement, strong CTR) to accelerate reach.
- Use reach/frequency or engagement objectives aligned with your goal.
- Test multiple creatives and audiences; kill underperformers quickly.
---
Common Myths and Pitfalls
- “Impressions are unique.” False. One person can generate multiple impressions.
- “If someone scrolls past fast, it won’t count.” Not necessarily. If the post rendered on-screen, it may count even with brief exposure.
- Chasing vanity metrics: High impressions without meaningful engagement or business outcomes can mislead. Tie your work to downstream metrics (leads, signups, revenue).
- Bots and quality filters: Some exposures may be filtered by anti-spam systems; assume analytics reflect best-effort quality controls.
- Analytics delays: Numbers can lag and later reconcile. Don’t optimize on minute-by-minute swings.
- Algorithm changes: Distribution patterns evolve. Re-test timing, formats, and hooks periodically.
---
TL;DR
- An impression on X is one exposure of your post; it’s not unique.
- Impressions are counted across timelines, search, profiles, replies, and repost contexts—screenshots and most off-platform views don’t count.
- Use impressions for awareness, but pair them with engagement rate and link clicks to judge quality.
- Paid and organic impression numbers differ due to targeting, frequency, and pacing.
- Find your data in per-post analytics and the account dashboard; export for deeper analysis.
- Improve impressions with strong hooks, native media, threads, smart timing, and strategic collaborations—supplement with paid when it makes sense.
Armed with a clear definition of what is an impression on Twitter and how it’s counted, you can set realistic goals, interpret your metrics correctly, and build content that earns both reach and results.
---
Summary
An impression on X is a single on-platform exposure, not a unique viewer, and it’s best interpreted alongside engagement rate and key clicks. Use X’s analytics as your source of truth, export data for deeper analysis, and iterate on hooks, media, timing, and collaborations to raise quality reach. With consistent measurement and smart experimentation, you can grow impressions that support real outcomes.


