What Is a Good Twitter Engagement Rate and How to Boost It
Learn the average Twitter engagement rate, how to calculate it, and proven strategies to boost interactions and grow an active audience.

Understanding Twitter Engagement Rate
Twitter engagement rate is a core metric that reveals how effectively your tweets connect with and inspire action among your followers. Knowing what is a good Twitter engagement rate allows you to measure the health of your social media presence, compare performance against industry averages, and refine your content strategy for better results. This guide explores definitions, benchmarks, calculation methods, and proven tactics to help you maximize engagement.
---
What Counts as Engagement on Twitter?
Engagement captures all the ways users interact with your tweets:
- Likes – the simplest form of approval.
- Retweets – sharing content with a follower's network.
- Replies – initiating conversation directly.
- Quote Tweets – retweets with personal commentary.
- Clicks – on links, hashtags, profiles, media, or polls.
These actions signal that your content resonates and can be used to guide future post types.
---
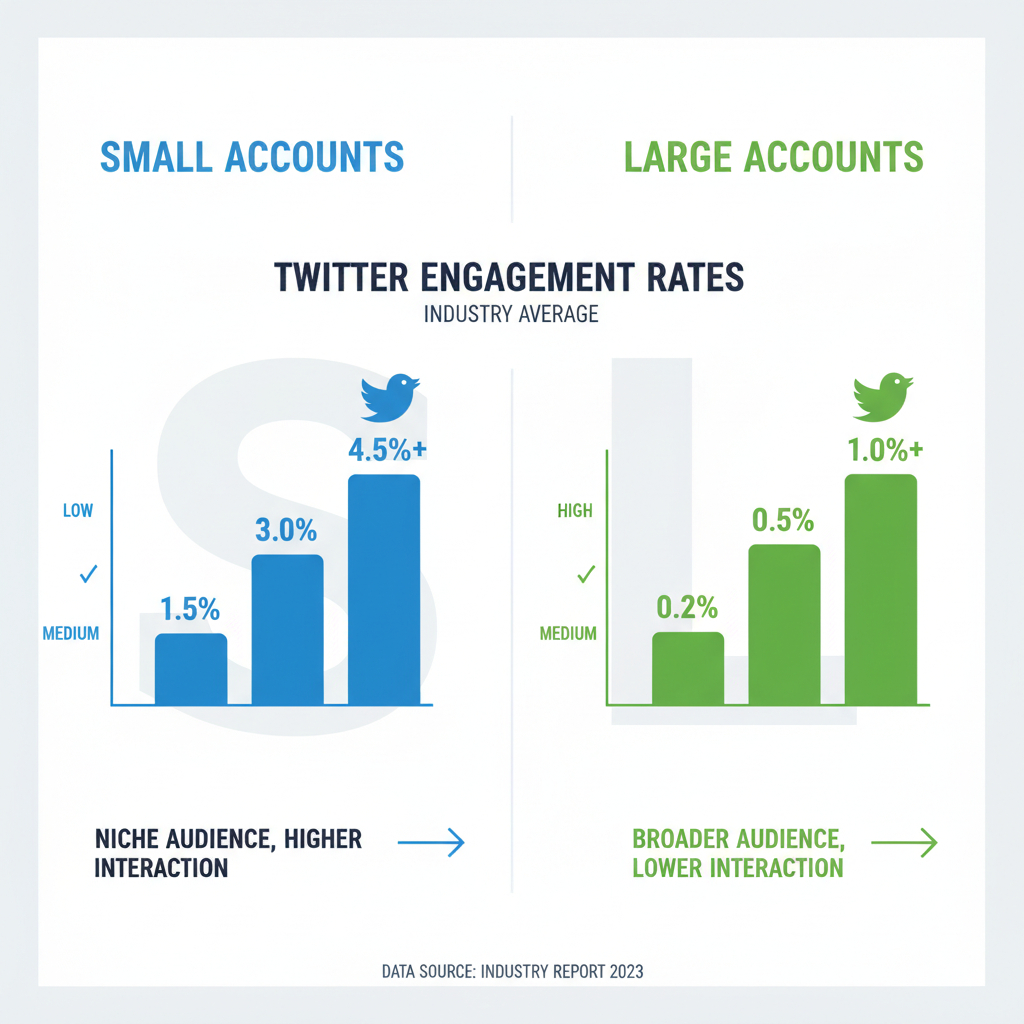
Industry Standard Average Engagement Rates
Social media marketing studies show engagement rates vary widely by audience size and niche:
- Average Twitter engagement rate commonly falls between 1% and 3%.
- Accounts with fewer than 1,000 followers often exceed 5%, thanks to tightly knit communities.
- Large accounts (100,000+ followers) average 0.5%–1%, as percentages drop when follower numbers rise.
---
Factors Influencing Engagement Rate
Key elements that can raise or lower your Twitter engagement rate include:
- Content Type – Visuals tend to grab attention and drive more clicks.
- Posting Time – Peak activity hours can boost visibility.
- Audience Quality – Relevant, interested followers produce higher engagement.
- Consistency – Regular posting strengthens long-term connections.
---
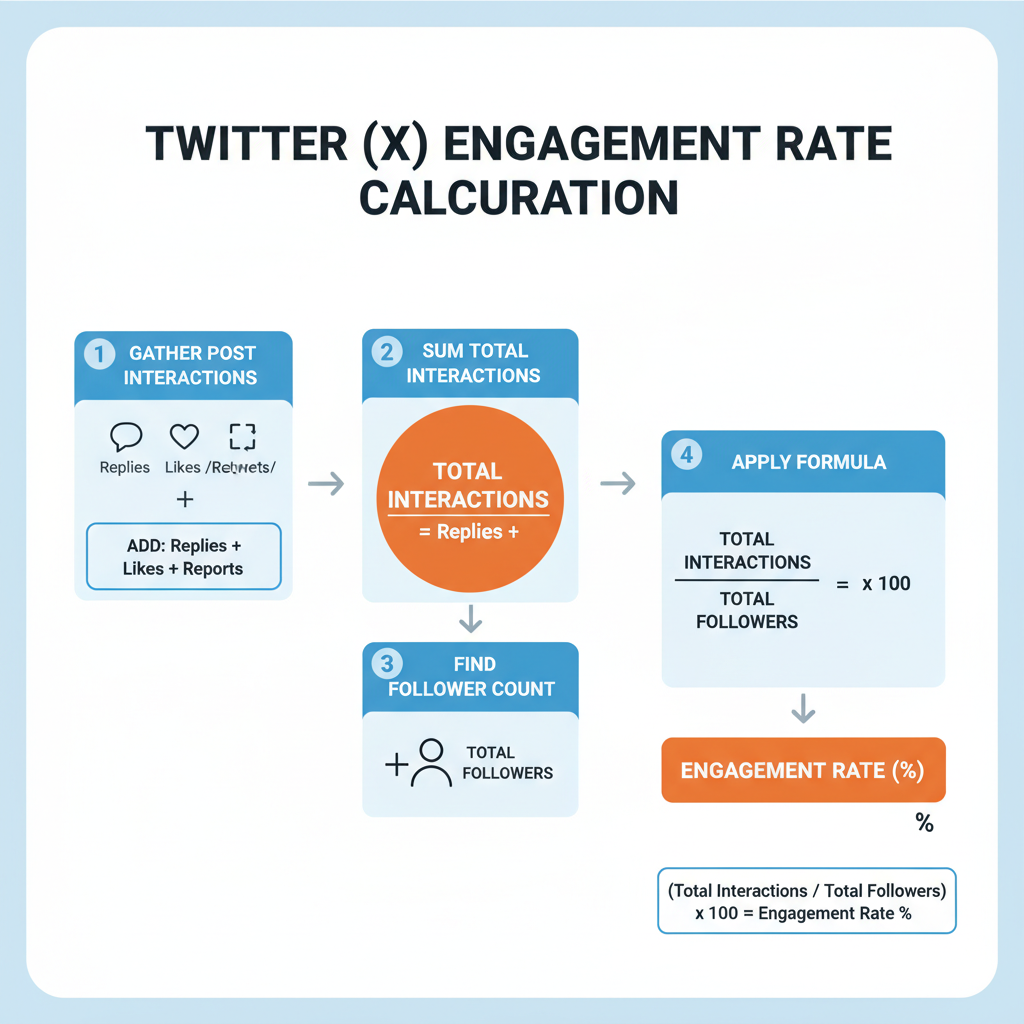
Calculating Your Twitter Engagement Rate Step-by-Step
Calculate your engagement rate manually or via analytics tools.
- Gather Data: Total engagements (likes, replies, retweets, clicks) per tweet.
- Check Impressions: How often the tweet appeared in feeds.
- Apply Formula:
- Example:
Engagement Rate (%) = (Total Engagements / Total Impressions) × 10050 engagements ÷ 2,000 impressions × 100 = 2.5%.
---
Small vs Large Account Benchmarks
Follower count influences average engagement rates:
| Follower Count | Average Engagement Rate | Notes |
|---|---|---|
| < 1,000 | 3% - 6% | Highly targeted audience with strong connections. |
| 1,000 - 20,000 | 1% - 3% | Moderate reach with steady engagement potential. |
| > 100,000 | 0.5% - 1% | Scale reduces percentage despite high interaction totals. |
---
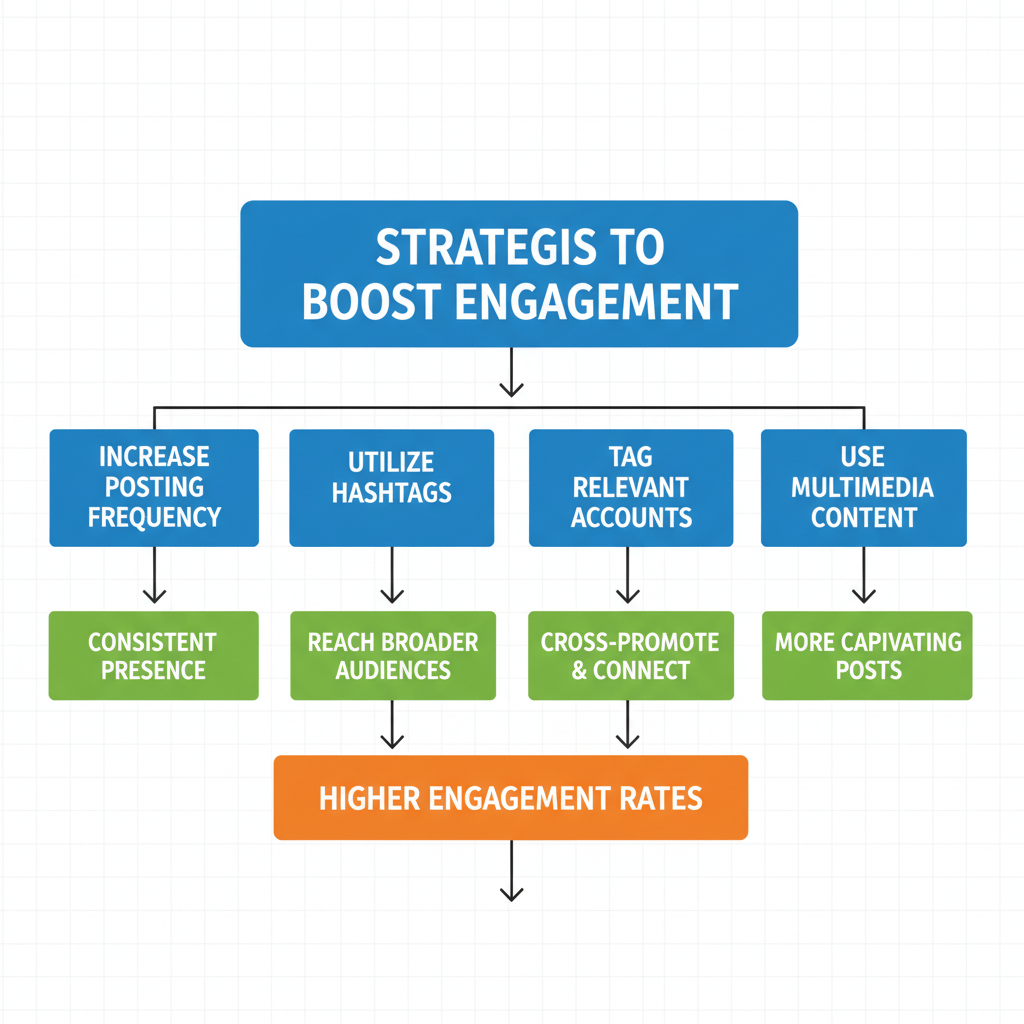
Strategies to Increase Engagement Rate
Boosting Twitter engagement rate requires intentional actions:
- Post Relevant Content – Address your audience’s interests.
- Ask Questions – Invite responses and spark dialogue.
- Launch Polls – Encourage quick, low-effort participation.
- Integrate Images/Videos – Visuals outperform plain text in crowded timelines.
- Tap Trends – Join viral conversations strategically.
---
Importance of Hashtags and Tagging Relevant Accounts
Hashtags improve discoverability, while tagging connects you directly to other users:
Hashtag Tips:
- Use 1–2 per tweet for ideal impact.
- Align with trending topics that fit your post.
- Avoid unrelated or excessive tags.
Tagging Tips:
- Mention influencers, brands, or partners with an interest in the topic.
- Tag multiple relevant accounts in group discussions to deepen reach.
---
Engaging Actively on Twitter
Active participation beyond posting boosts engagement:
- Reply Quickly – Answer questions and thank comments.
- Retweet Valuable Content – Support your community.
- Join Trends – Add unique insights to trending hashtags.
- Quote Tweet with Context – Provide perspective when sharing others’ posts.
---
Using Analytics Tools to Track Engagement Trends
Analytics tools help you understand what’s working:
- Twitter Analytics
- Hootsuite
- Sprout Social
- Buffer
Track rates over time, identify spikes, and correlate content types with higher performance.
---
Common Mistakes That Lower Engagement
Avoid these engagement killers:
- Spam Links – Link overload without value repels followers.
- Irregular Posting – Gaps in activity harm reach.
- Off-Topic Hashtags – Reduce trust and relevance.
- Ignoring Replies – Signals disinterest in audience input.
---
Case Study: Account Growth and Engagement Improvement
A small tech influencer with 800 followers and a 2% engagement rate improved by:
- Posting daily with relevant hashtags.
- Using strong visuals in 70% of posts.
- Running weekly polls.
- Responding to each comment promptly.
After 3 months:
- Followers grew to 1,500.
- Engagement rate climbed to 4.5%.
This demonstrates how consistent, value-focused interaction drives meaningful results.
---
Final Tips for Sustaining High Engagement
To keep engagement strong over time:
- Plan a Content Calendar – Schedule tweets consistently.
- Blend Formats – Combine text, visuals, polls, and threads.
- Review Monthly – Use analytics to tune strategies.
- Experiment with Posting Times – Find your audience’s preferred hours.
- Stay Flexible – Adapt to shifting trends quickly.
---
By understanding what defines a good Twitter engagement rate, striving to meet or exceed your industry’s benchmark, and applying a mix of content, outreach, and active participation, you can elevate your Twitter presence and inspire ongoing interaction.
Start tracking your engagement today, refine your strategy, and watch your Twitter community thrive!