Why Is Accounts Reached Different Than Views on Social Media
Learn why accounts reached differs from views, how platforms count each, and how to track both effectively to diagnose performance and optimize content.

If you’ve been asking “why is accounts reached different than views,” you’re not alone. These two social media metrics serve distinct purposes: reach reflects how many unique accounts saw your content, while views tally how many times it was played or loaded. Below, you’ll learn the key differences, platform nuances, examples, and practical tracking tips to use both metrics effectively and improve performance.
Introduction to Accounts Reached vs. Views
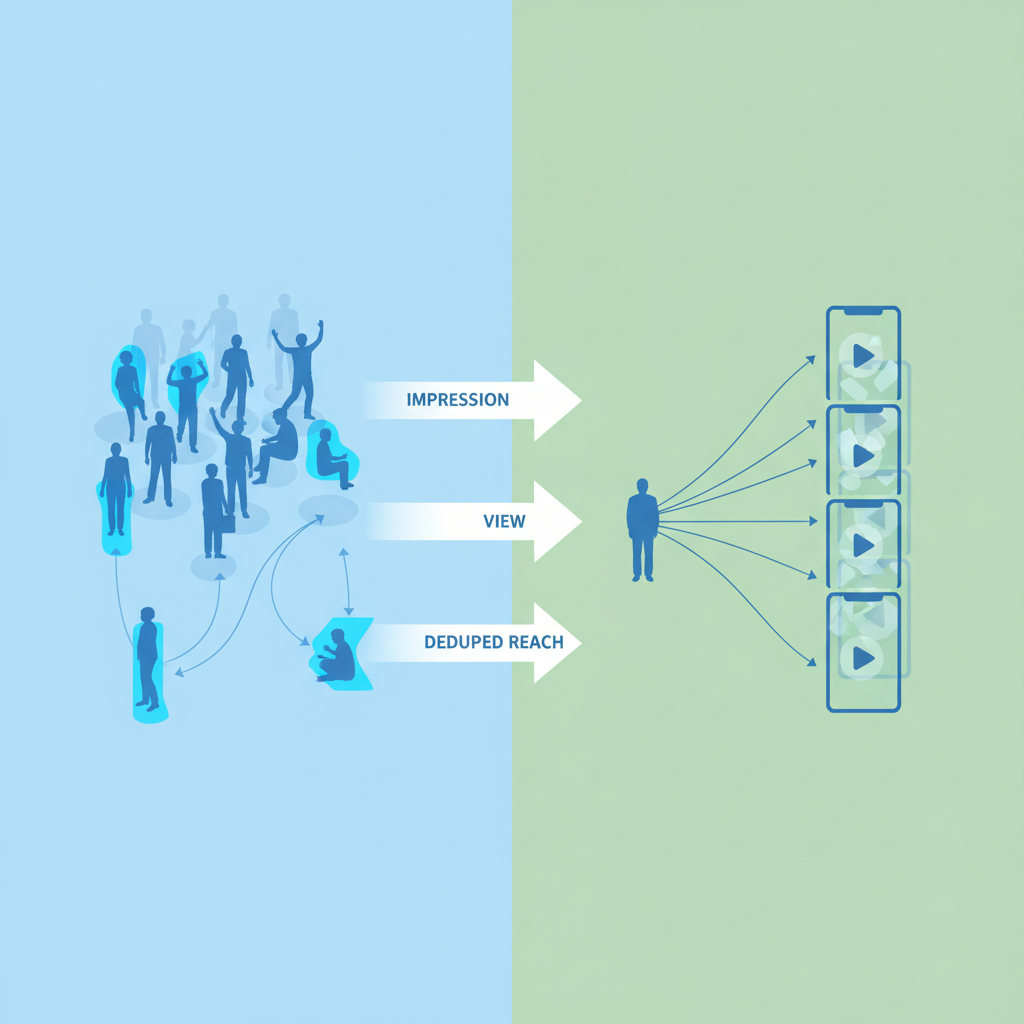
If you track social media performance, you’ve probably noticed that “Accounts Reached” and “Views” rarely match—even for the same post. This prompts a common question: why is accounts reached different than views? The short answer is that they measure two different things. Reach is about unique people (or accounts) your content touches; views are about how many times that content is watched or loaded, often counting multiple exposures by the same person.
Understanding the difference helps you set realistic goals, diagnose performance issues, and avoid misleading conclusions when comparing campaigns across platforms like Instagram, Facebook, TikTok, YouTube, and X (Twitter).

In this guide, we’ll define each metric, clarify how platforms count them, walk through examples, and share practical tips to track both effectively.
Defining "Accounts Reached" in Social Media Analytics
“Accounts Reached” (sometimes just called “Reach”) represents how many unique accounts saw your content at least once in the specified time frame. Key points:
- Unique accounts: Each account is counted once per content item or reporting window, even if that user sees the content multiple times.
- Visibility, not duration: Reach indicates exposure, not whether someone watched the entire video or engaged.
- Time-bounded: At the account level (e.g., weekly reach), it aggregates unique accounts across posts, Stories, Reels, etc., within that period.
- Surface-specific nuances: A single account may see your post via feed, Explore, or story shares. For content-level reach, that counts as one unique even if surfaced multiple ways.
Typical use cases:
- Measuring audience spread and distribution.
- Diagnosing algorithmic distribution or targeting success.
- Estimating the top of your funnel—how many unique people you’re getting in front of.
Defining "Views" and How They Are Counted
“Views” focus on how many times your content is played or rendered, often with platform-specific thresholds. Unlike reach, views can count multiple exposures from the same account.
Common principles:
- Non-unique: Views sum every play, including repeat watches.
- Thresholds vary: Platforms may require a minimum watch time or playback start to count a view.
- Format-specific: Video views differ from story views, post impressions, and carousel slide views.
Platform nuances (high-level, subject to change):
- Instagram and Facebook: Often require a brief watch threshold to count a video view; Reels show “Plays,” which can include auto-replays.
- TikTok: Typically counts a view when a video starts playing (including autoplay).
- YouTube: Employs more sophisticated detection to validate legitimate views and filter out spam or bot behavior.
- X (Twitter): Uses “views” or “impressions” on tweets to indicate loads, not necessarily watched time.
Views are useful for:
- Evaluating content consumption and replay propensity.
- Measuring creative resonance and retention.
- Analyzing whether your creative gets attention after initial exposure.
Core Differences Between Accounts Reached and Views
In practice, reach and views diverge because they answer different questions. Reach asks “How many unique people did we touch?” Views ask “How many times was the content consumed?”
Key differences:
- Uniqueness: Reach is de-duplicated by account; views are cumulative.
- Thresholds: Reach generally requires a content load in a feed or surface; views require a playback start or minimum watch.
- Behavioral sensitivity: Views rise with replays, loops, and longer watches; reach rises with distribution breadth.
- Time windows: Account-level reach sums unique exposures across the reporting period; views may be content lifetime totals.
Below is a concise comparison you can bring to stakeholders.
| Metric | What it Measures | Unique? | Typical Trigger | Examples (Labels) | Best Used For |
|---|---|---|---|---|---|
| Accounts Reached | Unique accounts that saw your content | Yes | Content rendered on a surface (feed, stories, explore) | “Reach”, “Accounts reached” | Distribution breadth, audience size |
| Views | Total plays/loads of content | No | Playback start or short watch threshold | “Views”, “Plays”, “Impressions” (format-specific) | Consumption, replays, retention |
Examples: How One Post Can Have Higher Views Than Reach
Let’s illustrate why views often exceed reach even for the same asset.
Example 1: A short Reel
- Suppose 1,000 unique accounts see your Reel (reach = 1,000).
- 400 people watch twice, and 200 watch three times (thanks to looping and a catchy hook).
- Total views could be 1,000 + 400 + 400 = 1,800 (or higher, depending on definition), while reach stays at 1,000.
Example 2: A story with replays
- 900 unique accounts check your story once.
- 150 accounts replay it, and 50 forward it to friends who watch it again.
- Story views might climb to 1,200+, but reach might remain around 900 (unique accounts who saw it).
Example 3: YouTube long-form video
- 5,000 unique viewers discover the video within a week.
- Some viewers return multiple times or watch across devices.
- Views can grow rapidly from repeat sessions; reach growth depends on new unique viewers finding the video.
These scenarios underscore the core point: reach counts unique eyes; views count total consumption events. That’s exactly why accounts reached is different than views in nearly every analytics dashboard.
Factors That Influence Reach Metrics
Reach depends largely on distribution and discoverability. If your content is pushed to more people—or found by more people—reach rises.
Key drivers
- Audience size and quality: Larger, active follower bases boost initial reach.
- Algorithmic distribution: High engagement early often earns more placements (feed, Explore, For You).
- Posting cadence and timing: Publishing when your audience is active increases initial exposure.
- Content format: Reels, Shorts, and Stories may be prioritized differently than static posts.
- Network effects: Shares, mentions, and collaborations expose your content to new audiences.
- Paid promotion: Ads and boosts expand reach by targeting outside your followers.
- Topical relevance: Trend-aligned or timely content surfaces more often.
Operational tips
- Use platform-native hooks and formats (e.g., vertical video with dynamic captions).
- Encourage shares and saves early to trigger algorithms.
- Test thumbnails and first-frame clarity for Reels/Shorts to win the scroller’s glance.
Factors That Influence View Metrics
Views hinge on attention and replay behavior. Once a user lands on your content, can you keep them watching—and entice rewatching?
Key drivers
- Hook quality: Strong first three seconds dramatically improve video starts.
- Length and pacing: Tight edits, pattern interrupts, and chaptering keep people watching.
- Loopability: Seamless loops encourage replays, increasing total views.
- Sound and captions: Subtitles, sound bites, and music cues reinforce engagement.
- Relevance and novelty: Content that answers a specific need or delivers “aha” moments is more rewatchable.
- UX triggers: Autoplay, end screens, and playlists increase view counts.
- Cross-promotion: Embedding or linking in newsletters and blogs can spike views (even if reach gains are modest).
Operational tips
- Add a visual hook in the first second; prioritize clarity in the thumbnail and title.
- Use retention graphs (where available) to spot drop-off points and refine edits.
- Experiment with loops, callbacks, and series formats to encourage repeat views.
Common Misunderstandings About Reach vs. Views
These misconceptions cause reporting errors and misaligned expectations:
- “Views equal unique people.” False. Views can include replays by the same person.
- “Low reach means bad content.” Not necessarily; distribution may be limited even if those who do see it watch extensively.
- “High reach guarantees conversions.” Reach is top-of-funnel. Without strong creative and offer, it may not convert.
- “Impressions and views are the same.” Impressions are loads; views often require playback start or watch time.
- “Account-level reach equals content-level reach.” Account-level reach aggregates across posts; content-level reach is specific to one asset.
- “Platform definitions are identical.” Each platform defines view thresholds, impression logic, and deduplication differently.
If your stakeholders keep asking why is accounts reached different than views, anchor the conversation in uniqueness versus consumption, and stress platform-specific counting rules.
Why the Two Metrics Often Differ Significantly
The divergence between reach and views is structural, not anomalous.
- Behavioral repetition: People replay content they like, watch loops, or return to a video later. Views grow; reach usually doesn’t.
- Algorithmic resurfacing: The same account may be shown the same asset multiple times over days. That increases views but not unique reach for that content.
- Format mechanics: Reels/Shorts auto-loop; Stories can be replayed easily; playlists drive repeat views.
- Counting thresholds: A content load can count toward reach before a view threshold is met. Conversely, a view can occur on the same platform surface multiple times without increasing unique reach.
- Reporting windows: A single account’s repeated views across days boost total views; the unique account count often stabilizes once most of the reachable audience has seen it.
- Cross-device behavior: One person may watch from phone and desktop. Depending on how platforms deduplicate, views can multiply while reach may or may not combine those exposures.
Together, these factors explain why you’ll nearly always see views exceeding reach for replay-friendly formats, and why the relationship between these metrics isn’t linear.
Practical Tips for Tracking Both Metrics Effectively
To build a clean, reliable analytics practice:
- Define your KPIs by funnel stage:
- Awareness: Accounts reached (unique), impressions.
- Engagement: Views, average watch time, CTR, saves, shares.
- Conversion: Click-throughs, sign-ups, sales.
- Track platform-specific definitions:
- Document view thresholds and labeling differences (e.g., “Plays” vs. “Views”).
- Note whether metrics are content-level or account-level.
- Segment your reporting:
- Organic vs. paid reach/views.
- Followers vs. non-followers.
- Content format (Reels/Shorts, Stories, Posts).
- Normalize time windows:
- Compare performance in consistent windows (e.g., first 72 hours), then lifetime.
- Monitor ratios:
- Views-to-reach ratio: Indicates rewatch behavior and replayability.
- Watch time per view: Indicates content retention quality.
- Avoid cross-platform apples-to-oranges:
- Don’t directly compare YouTube views to TikTok views without context; thresholds and validation differ.
Simple analytics model (conceptual):
- Reach: count distinct users exposed to content within period.
- Views: count total playback events for content within period.
You can sketch this in your data warehouse with a straightforward query.
-- Example: Compute reach vs. views for a single content_id
-- events table: one row per exposure or playback
-- columns: content_id, user_id, event_type, event_timestamp

WITH filtered AS (
  SELECT *
  FROM events
  WHERE content_id = 'POST_123'
    AND event_timestamp >= '2025-09-01'
    AND event_timestamp <  '2025-10-01'
)
SELECT
  COUNT(DISTINCT CASE WHEN event_type IN ('impression','view_start') THEN user_id END) AS accounts_reached,
  COUNT(CASE WHEN event_type = 'view_start' THEN 1 END) AS views
FROM filtered;
Implementation notes:
- Tailor event types to your schema (e.g., “impression” for reach, “view_start” for views).
- Add platform-specific filters if aggregating cross-channel data.
- For retention or average watch time, join view_start with view_complete or duration fields.
Finally, align reporting with stakeholder needs:
- Marketing wants breadth (reach) to prove awareness.
- Content teams want consumption and retention (views, watch time).
- Growth wants conversion metrics layered onto both (CTR, leads, sales).
Summary and Next Steps
To recap, accounts reached measures unique exposure, while views capture total consumption—including replays and loops. That’s why is accounts reached different than views on nearly every platform. Use both: optimize reach to expand your audience, and optimize views to deepen engagement and improve retention.
Call to action:
- Audit your last 10 posts for views-to-reach ratio and watch time.
- Document platform-specific definitions in your reporting guide.
- Set clear KPIs by funnel stage and track them weekly to spot trends you can act on.