Create High-Impact Social Media Infographics That Get Shared
Learn how to research, design, and share social media infographics that grab attention, connect with your audience, and boost engagement.
Create High-Impact Social Media Infographics That Get Shared
In today’s crowded digital landscape, cutting through the noise takes more than text posts and stock photos. Social media infographics can help you stand out by combining compelling visuals with clear, digestible information. They not only grab attention but also boost engagement and shares—making them one of the most powerful content formats for marketers, educators, and influencers alike.
This guide walks you through how to research, design, and distribute infographics that connect with your audience and amplify your reach.

---
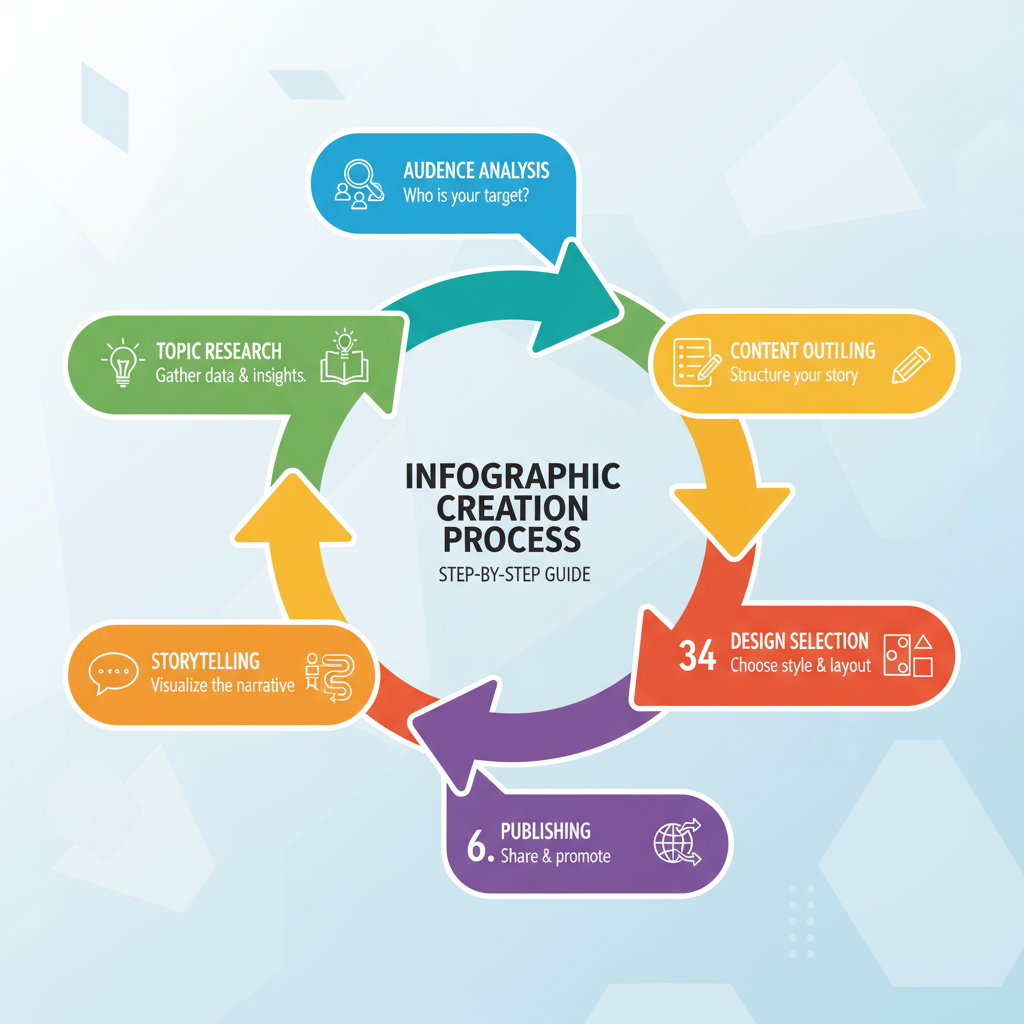
Understand Your Target Audience’s Pain Points and Goals
Before you open your design tool, know exactly who you’re creating for. Identify:
- Primary demographics: age, location, profession, and interests.
- Preferred content types: data-driven, inspirational, or instructional.
- Common challenges: struggles your audience faces within your niche.
When your infographic directly answers a question or solves a problem, you form an instant connection. Use Google Analytics, Meta Audience Insights, and audience surveys to gather the data you need to create focused content.
---
Research Trending Topics and Gather Credible Data
A good infographic is timely, relevant, and well-sourced.
Look for trending topics via:
- Google Trends, BuzzSumo, and TrendHunter to anticipate conversations.
- Industry reports, government statistics, or case studies for solid data.
- Community forums like Reddit, LinkedIn groups, and specialized boards.
Prioritize authoritative sources—credible data builds trust and increases share-worthiness.
---
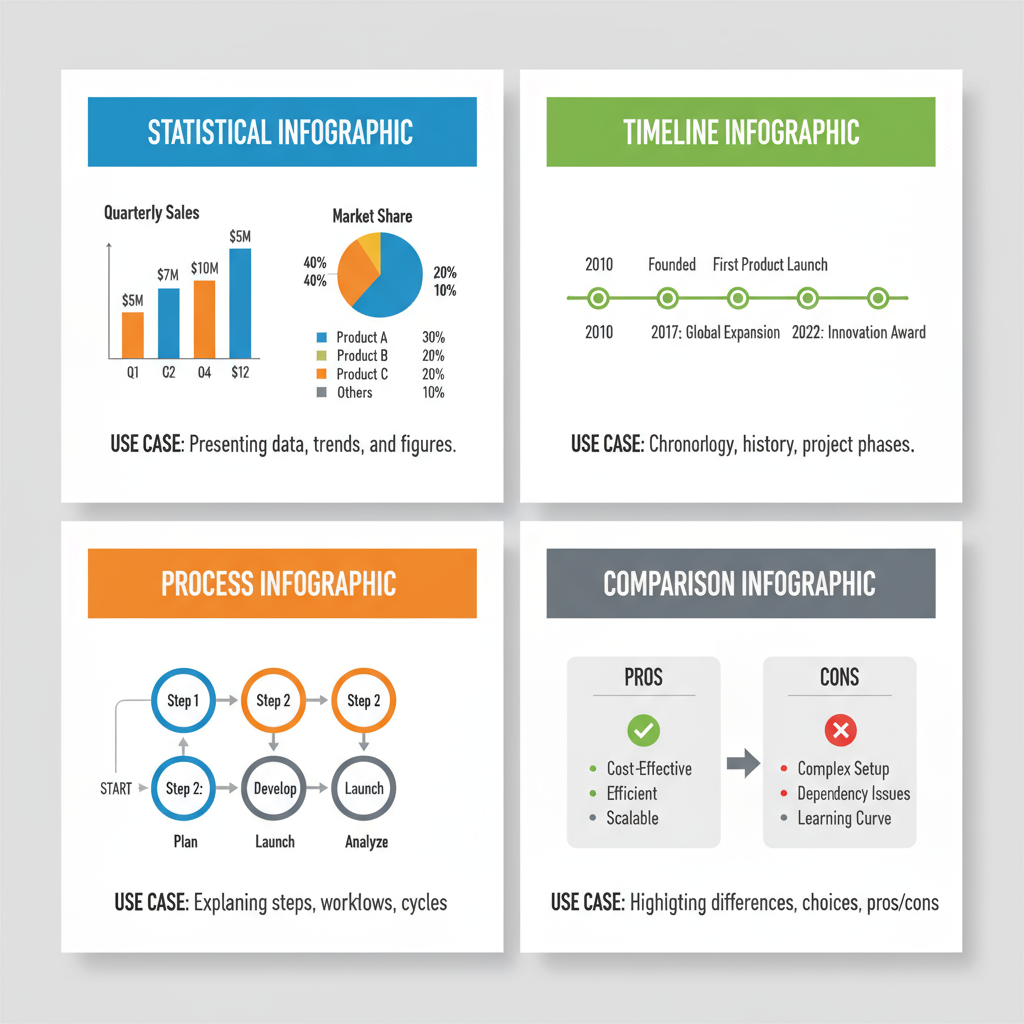
Choose the Right Infographic Type
Selecting a fitting format is crucial for clarity and impact.
| Infographic Type | Best Use Case | Example |
|---|---|---|
| Statistical | Present research data, surveys, or market metrics | "2024 Social Media Usage Statistics" |
| Timeline | Show a historical sequence or scheduled milestones | "Evolution of Digital Marketing Channels" |
| Process | Explain workflows or step-by-step procedures | "How to Launch a Podcast in 6 Steps" |
| Comparison | Contrast products, strategies, or trends | "Instagram vs TikTok Marketing Effectiveness" |
Choosing your type early gives your design structure and direction.
---
Outline Your Content for Maximum Clarity
A clear outline prevents overcrowding and keeps your design on-point:
- Headline – Compelling and benefit-driven.
- Supporting Data Points – Group insights logically.
- Visual Hierarchy – Make key facts stand out via size, color, or boldness.
- Flow – Lead viewers naturally from one section to the next.
Less is often more—overloading visuals with text can discourage sharing.
---
Keep Design Elements Brand-Consistent
To make your infographics instantly recognizable:
- Stick to your brand’s core colors.
- Pair a decorative font for headings with a clean, readable body font.
- Select iconography with consistent style (line art, flat, filled).
Uniform visual elements strengthen brand recall and trust.
---
Choose the Right Design Tool
Different tools suit different skill levels and needs.
| Tool | Skill Level | Strengths |
|---|---|---|
| Canva | Beginner-Friendly | Ready templates, fast exports, ideal for social media |
| Figma | Intermediate | Collaboration features, prototyping, browser-based |
| Adobe Illustrator | Advanced | High-precision vector creation, print-quality output |
Pick based on your skill, project scope, and publishing needs.
---
Tell a Story, Not Just Facts
Facts alone may be informative—but stories make them stick. Use these steps:
- Start: Present the audience’s problem or a curiosity gap.
- Middle: Provide data illustrating the situation.
- End: Offer a practical insight, tip, or solution.
A stat like “80% of small businesses use social media” becomes more engaging when tied to a personal success story.
---
Optimize Dimensions for Each Platform
Platform requirements affect how your infographic displays.
| Platform | Recommended Size | Aspect Ratio |
|---|---|---|
| Instagram Feed | 1080 x 1350 px | 4:5 |
| 1000 x 1500 px | 2:3 | |
| Twitter/X | 1600 x 900 px | 16:9 |
| 1200 x 627 px | 1.91:1 |
Right-sizing prevents pixelation and awkward cropping.
---
Incorporate Discreet Branding and Strong CTAs
Place a small logo and maintain brand colors, but avoid overpowering the content. Craft concise calls-to-action that flow naturally, such as:
> “Learn more tips at [YourWebsite.com]”
> “Follow us for fresh marketing insights”
The goal is to invite, not overwhelm.
---
Test Variations and Analyze Engagement
Run A/B tests to compare:
- Alternate headlines
- Color tweaks and icon styles
- Different data arrangements
Measure CTR, shares, saves, and comments to see what resonates most. Use integrated analytics or scheduling tools for faster insights.
---
Promote Across Multiple Channels and with Influencers
Broaden visibility by:
- Posting on Instagram, Pinterest, TikTok, LinkedIn, and X/Twitter.
- Sharing in targeted groups, community boards, and via email.
- Partnering with niche influencers for co-distribution.
Make it easy—provide ready-to-share files and sample captions.
---
Track, Review, and Repurpose Content
Monitor KPIs such as:
- Shares & Reposts
- Saves & Bookmarks
- Click-Throughs
- Viewing Time
Update top performers with fresh data or seasonal styling. Repurposing proven designs saves time while sustaining engagement.
---
Summary
High-impact social media infographics blend strategic research, compelling storytelling, and optimized visual design. Begin with a deep understanding of your audience, choose the right format, and tailor your visuals for each platform. Subtle branding, sharp CTAs, and consistent testing will maximize shareability and reinforce your brand’s presence.
Ready to turn your next infographic into a viral conversation starter? Start applying these steps today and watch your content get seen—and shared—by more of the right people.